Data from: Broadband Access and Health Outcomes in FCC Priority Counties: A Longitudinal Analysis
The 4 tables and 11 figures from the article, as CSV files and the original images.
Reese Green · Max von Franque · Melissa Martinez · Alister Martin
- Published
- September 26, 2026
- Version
- 1.0.0
- Files
- 23 release files
About this dataset
Overview
The tables and figures from “Broadband Access and Health Outcomes in FCC Priority Counties: A Longitudinal Analysis,” published in ConductScience Journal on February 24, 2025, as separate files. Each table is a CSV file copied cell by cell from the final accepted manuscript, and each figure is the image embedded in that manuscript. The record holds 4 tables and 11 figures.
Inspect before download
Data preview
table-1.csv · first 4 rows
| County Characteristic | Counties, n (%) |
|---|---|
| Rurala | 135 (78.9) |
| PCP Shortageb | 51 (29.8) |
| Persistent Povertyc | 44 (25.7) |
| Veterand | 122 (71.3) |
Read the columns
Data dictionary
table-1.csv
Table 1. Demographics characteristics of FCC 2017 priority counties (N=171).
table-2.csv
Table 2. Trends in preventable hospitalizations, obesity, diabetes, and broadband access in FCC priority counties from 2013- 2020.
figure-1.png
Figure 1. Figure Caption: The Pearson’s correlation matrix explores linear relationships between continuous variables, using averages across all 171 FCC priority counties and over time periods (2013-2020).
table-3.csv
Table 3. Regression analyses of relationships between broadband and health outcomes over time (2013-2020) in FCC priority counties (N=171), controlling for county-level characteristics.
figure-s1a.png
Figure S1A. Figure Caption: Pearson’s correlation matrix of relationships between continuous variables including averages across all 187 FCC priority counties (including the 16 counties identified as potential outlier) and over time periods (2013-2020).
figure-s1b.png
Figure S1B. Figure Caption: Spearman’s correlation matrix of relationships between continuous variables including averages across all 187 FCC priority counties (including the 16 counties identified as potential outlier) and over time periods (2013-2020).
figure-s1c.png
Figure S1C. Figure Caption: Pearson’s correlation matrix of relationships between continuous variables including averages across 171 FCC priority counties (excluding the 16 counties identified as potential outlier) and over time periods (2013-2020).
figure-s1d.png
Figure S1D. Figure Caption: Spearman’s correlation matrix of relationships between continuous variables including averages across all 187 FCC priority counties (including the 16 counties identified as potential outlier) and over time periods (2013-2020).
figure-s2a.png
Figure S2A. Figure Caption: Boxplots explore the mean and variance of percent of diabetes prevalence in a county, grouping by county characteristics and averaging across FCC priority counties (N=171) and over time (2013-2020). PCPS: Primary Care Physician Shortage; PP: Persistent Poverty; Vet: Veteran.
figure-s2b.png
Figure S2B. Figure Caption: Boxplots explore the mean and variance of obesity prevalence in a county, grouping by county characteristics and averaging across FCC priority counties (N=171) and over time (2013-2020). PCPS: Primary Care Physician Shortage; PP: Persistent Poverty; Vet: Veteran.
figure-s2c.png
Figure S2C. Figure Caption: Boxplots explore the mean and variance of the number of preventable hospitalizations in a county, grouping by county characteristics and averaging across FCC priority counties (N=171) and over time (2013-2020). PCPS: Primary Care Physician Shortage; PP: Persistent Poverty; Vet: Veteran.
figure-s2d.png
Figure S2D. Figure Caption: Boxplots explore the mean and variance of broadband speed (Mbps) in a county, grouping by county characteristics and averaging across FCC priority counties (N=171) and over time (2013-2020). PCPS: Primary Care Physician Shortage; PP: Persistent Poverty; Vet: Veteran.
figure-s2e.png
Figure S2E. Figure Caption: Boxplots explore the mean and variance of percent of households in a county with broadband subscriptions, grouping by county characteristics and averaging across FCC priority counties (N=171) and over time (2013-2020). PCPS: Primary Care Physician Shortage; PP: Persistent Poverty; Vet: Veteran.
figure-s2f.png
Figure S2F. Figure Caption: Boxplots explore the mean and variance of percent of households in a county with advanced broadband speeds (> 25 Mbps), grouping by county characteristics and averaging across FCC priority counties (N=171) and over time (2013-2020). PCPS: Primary Care Physician Shortage; PP: Persistent Poverty; Vet: Veteran.
table-s1.csv
Table S1. Sensitivity analyses of relationships between broadband and health outcomes over time (2013-2020) in FCC priority counties including potential outliers (N=187), controlling for county-level characteristics.
Files
broadband-health-outcomes-data-1.0.0.zip
1.4 MBComplete frozen release: 21 source-manifest files plus MANIFEST.json.
SHA-256 175f0a5e8e3811c64b6edad09013137829ef6c300536daceec0924db9e2f143b
table-1.csv
132 bytesTable 1. Demographics characteristics of FCC 2017 priority counties (N=171).
SHA-256 e9ca81b78b56a3332c75e90bf25ec00e77fed4b06d98d177868d6c0f3e703587
table-2.csv
538 bytesTable 2. Trends in preventable hospitalizations, obesity, diabetes, and broadband access in FCC priority counties from 2013- 2020.
SHA-256 ef16d6c61cb8d587032d2fe8dd9dadaf56466aee3598bcae3daeed99406b4b44
figure-1.png
70.4 kBFigure 1. Figure Caption: The Pearson’s correlation matrix explores linear relationships between continuous variables, using averages across all 171 FCC priority counties and over time periods (2013-2020).
SHA-256 d34de8a7205d3c7b96c0ce4365900c966d6bf644212fd7773139be59429fb863
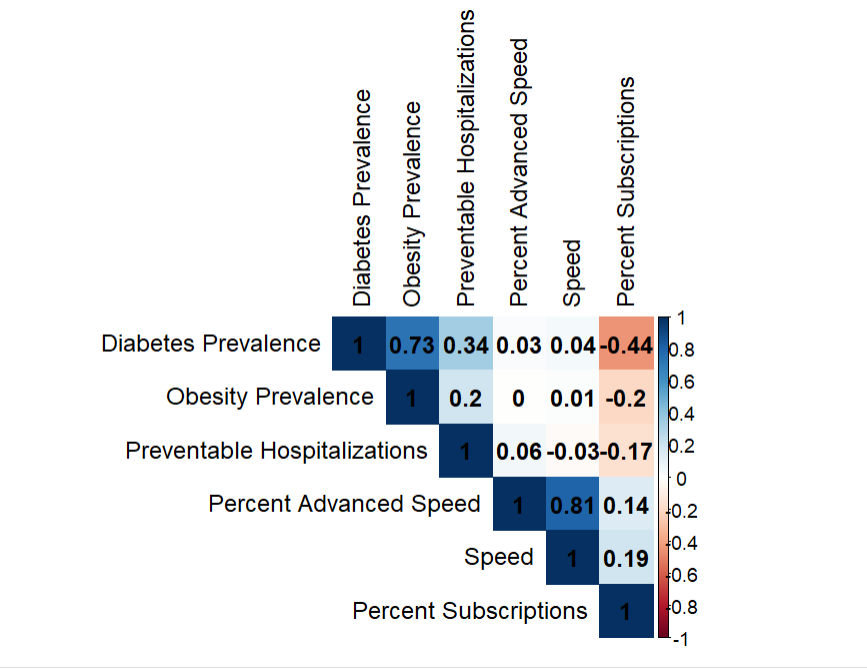
table-3.csv
1.2 kBTable 3. Regression analyses of relationships between broadband and health outcomes over time (2013-2020) in FCC priority counties (N=171), controlling for county-level characteristics.
SHA-256 cecb84115880addc61001d97927cbe9878eda7e7ffc79b949d0ec90f2cf1a7d4
figure-s1a.png
84.5 kBFigure S1A. Figure Caption: Pearson’s correlation matrix of relationships between continuous variables including averages across all 187 FCC priority counties (including the 16 counties identified as potential outlier) and over time periods (2013-2020).
SHA-256 dfab3a8fbb2973968df95ec7b908ba97070bb6a67cb756fc14078437e3d72b61
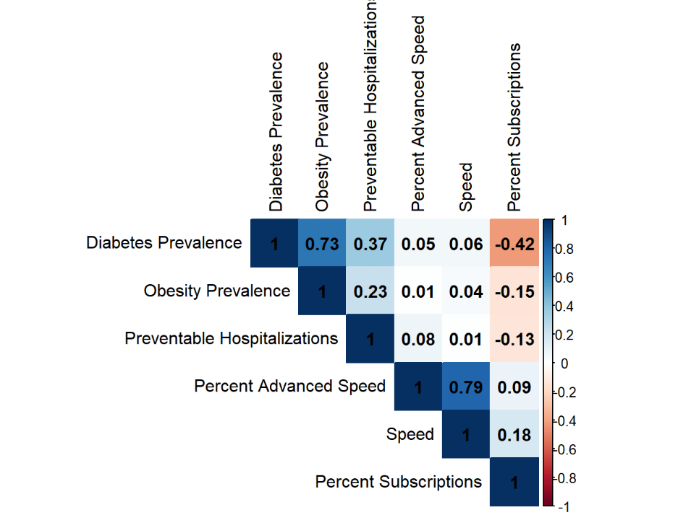
figure-s1b.png
80.4 kBFigure S1B. Figure Caption: Spearman’s correlation matrix of relationships between continuous variables including averages across all 187 FCC priority counties (including the 16 counties identified as potential outlier) and over time periods (2013-2020).
SHA-256 137531db6038d603e3b823eb3759387153d62fb4a248224d9e1bfd1d3f84d711
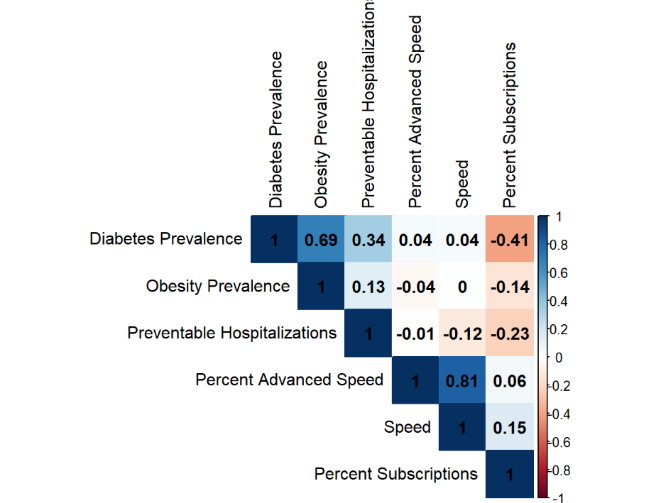
figure-s1c.png
103.6 kBFigure S1C. Figure Caption: Pearson’s correlation matrix of relationships between continuous variables including averages across 171 FCC priority counties (excluding the 16 counties identified as potential outlier) and over time periods (2013-2020).
SHA-256 7ec74d97833a395cae5bb75cbc438571aa776379e253f919cb3e40f1b6f297e4
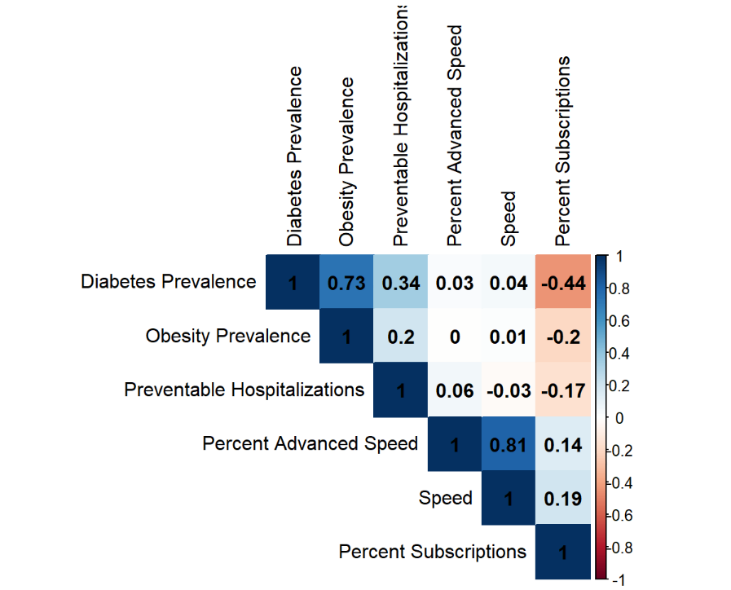
figure-s1d.png
89.1 kBFigure S1D. Figure Caption: Spearman’s correlation matrix of relationships between continuous variables including averages across all 187 FCC priority counties (including the 16 counties identified as potential outlier) and over time periods (2013-2020).
SHA-256 c0d720e81a0de28aa8121bc158c9b6f3bf05b48774a00cc3e2c67988e1b71be2
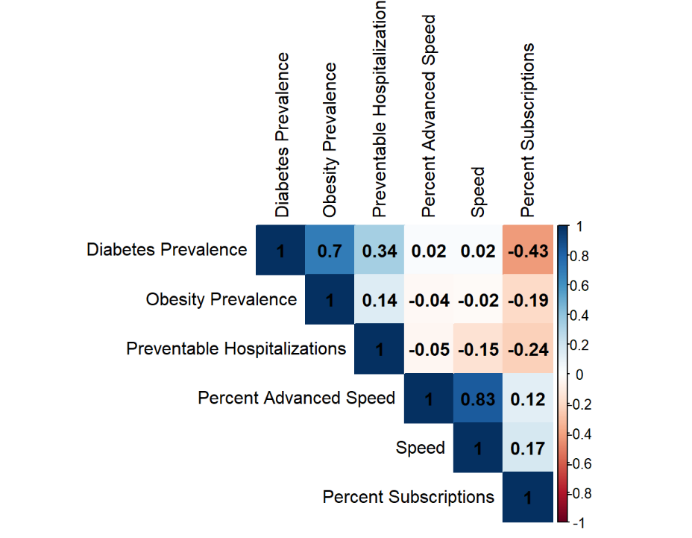
figure-s2a.png
187.2 kBFigure S2A. Figure Caption: Boxplots explore the mean and variance of percent of diabetes prevalence in a county, grouping by county characteristics and averaging across FCC priority counties (N=171) and over time (2013-2020). PCPS: Primary Care Physician Shortage; PP: Persistent Poverty; Vet: Veteran.
SHA-256 3b26846eff3b0972020210dd4386cb49e90eeba0e420948c68b26b430cd097f5
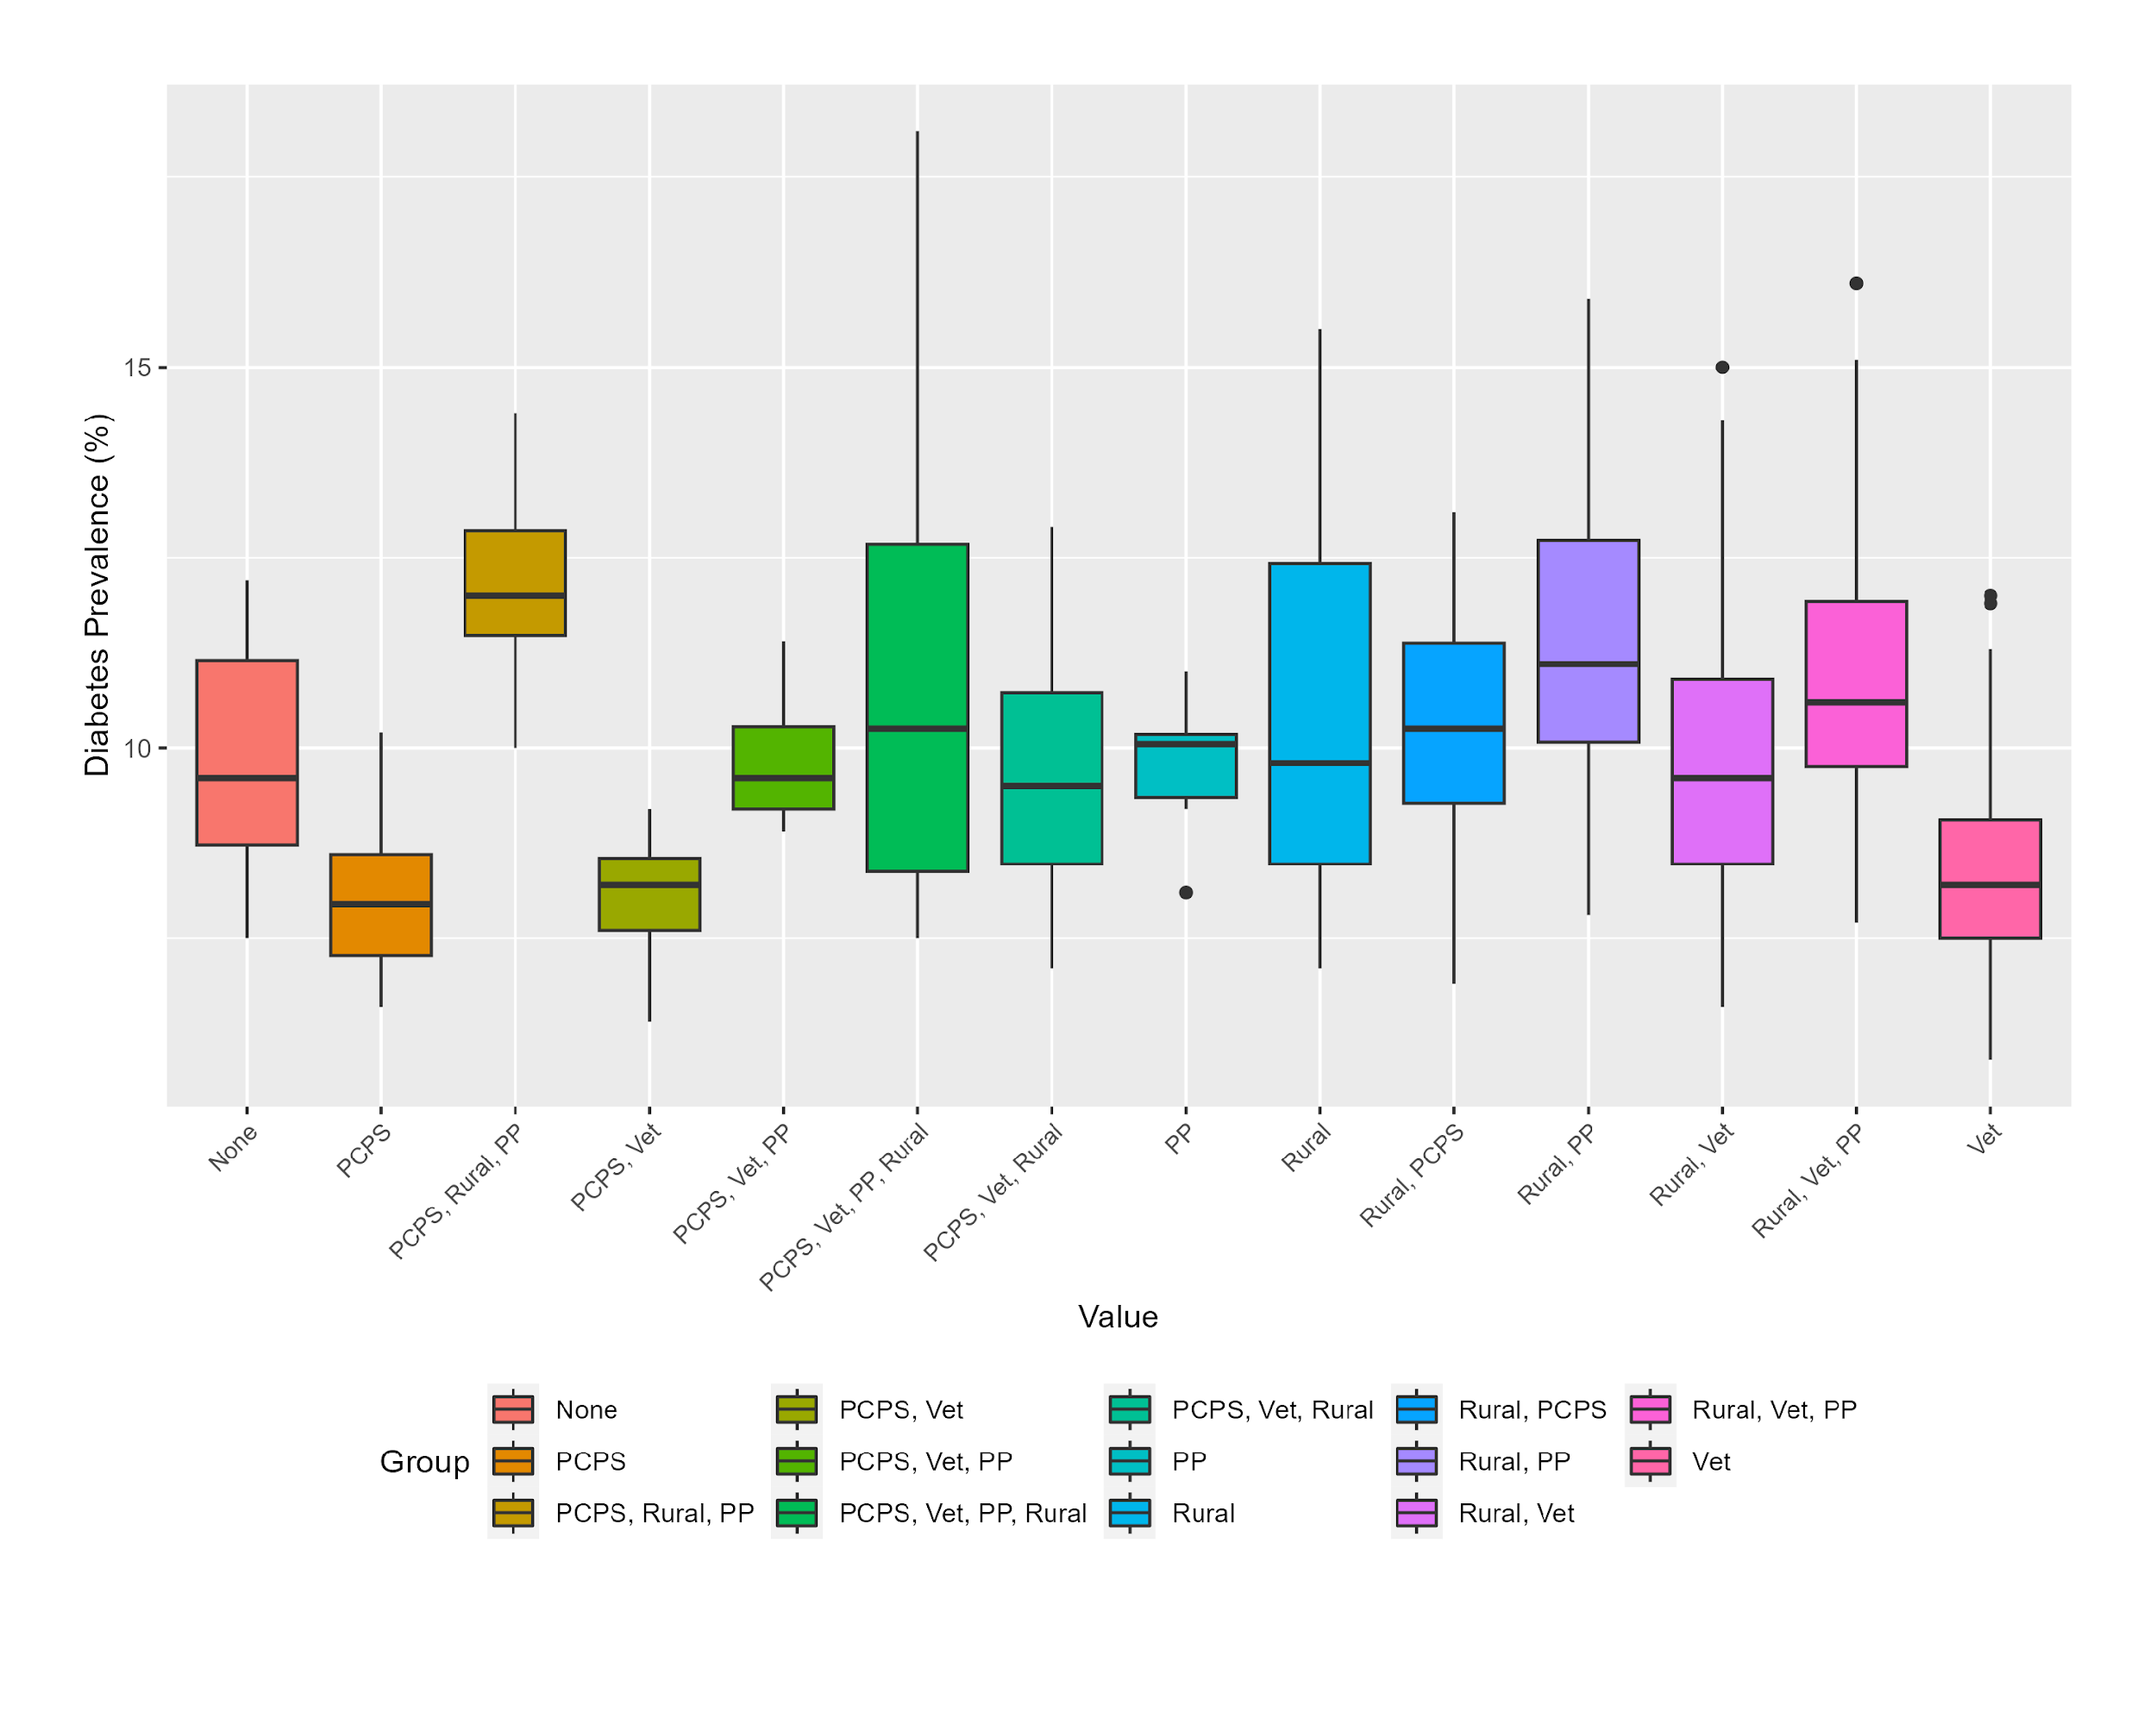
figure-s2b.png
195.5 kBFigure S2B. Figure Caption: Boxplots explore the mean and variance of obesity prevalence in a county, grouping by county characteristics and averaging across FCC priority counties (N=171) and over time (2013-2020). PCPS: Primary Care Physician Shortage; PP: Persistent Poverty; Vet: Veteran.
SHA-256 8b8cc07dea535e5a40825ed11685c371b9d3a3210dd11800871dafd6e4f00f46
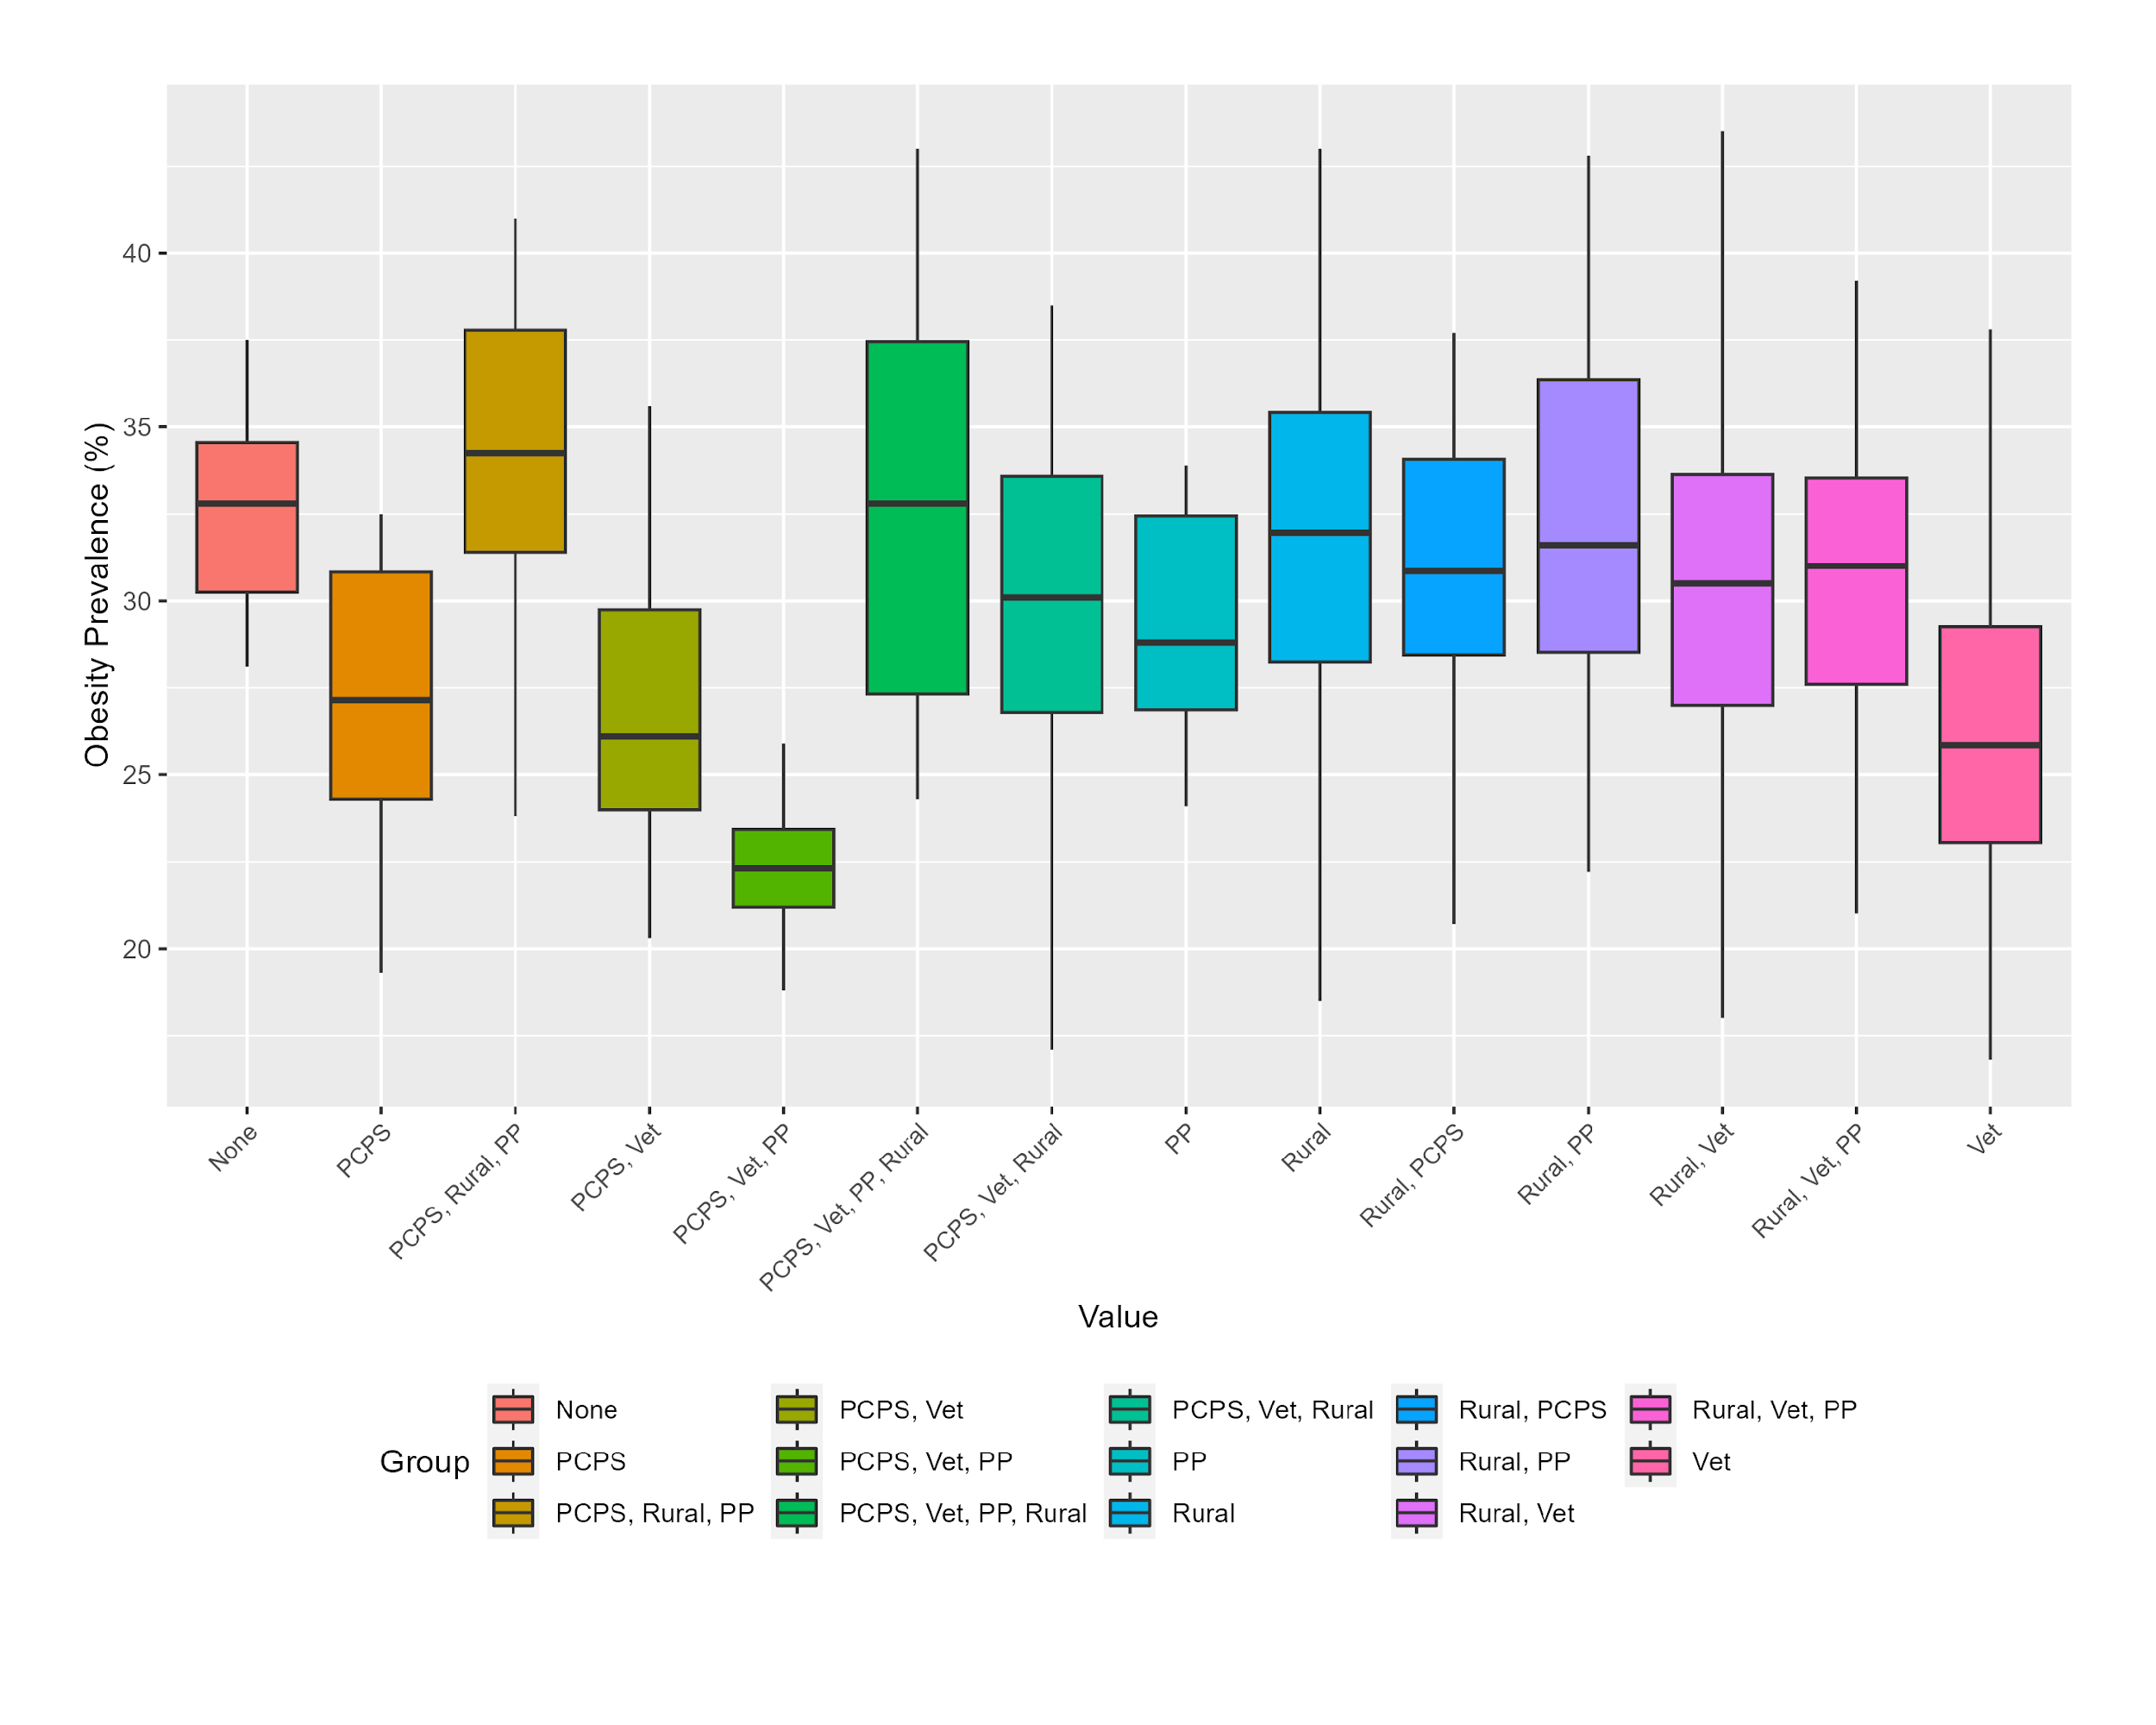
figure-s2c.png
197.1 kBFigure S2C. Figure Caption: Boxplots explore the mean and variance of the number of preventable hospitalizations in a county, grouping by county characteristics and averaging across FCC priority counties (N=171) and over time (2013-2020). PCPS: Primary Care Physician Shortage; PP: Persistent Poverty; Vet: Veteran.
SHA-256 6555286abbd44cacdf9e028866b9591988302743edb19407e6d539966a657e1f
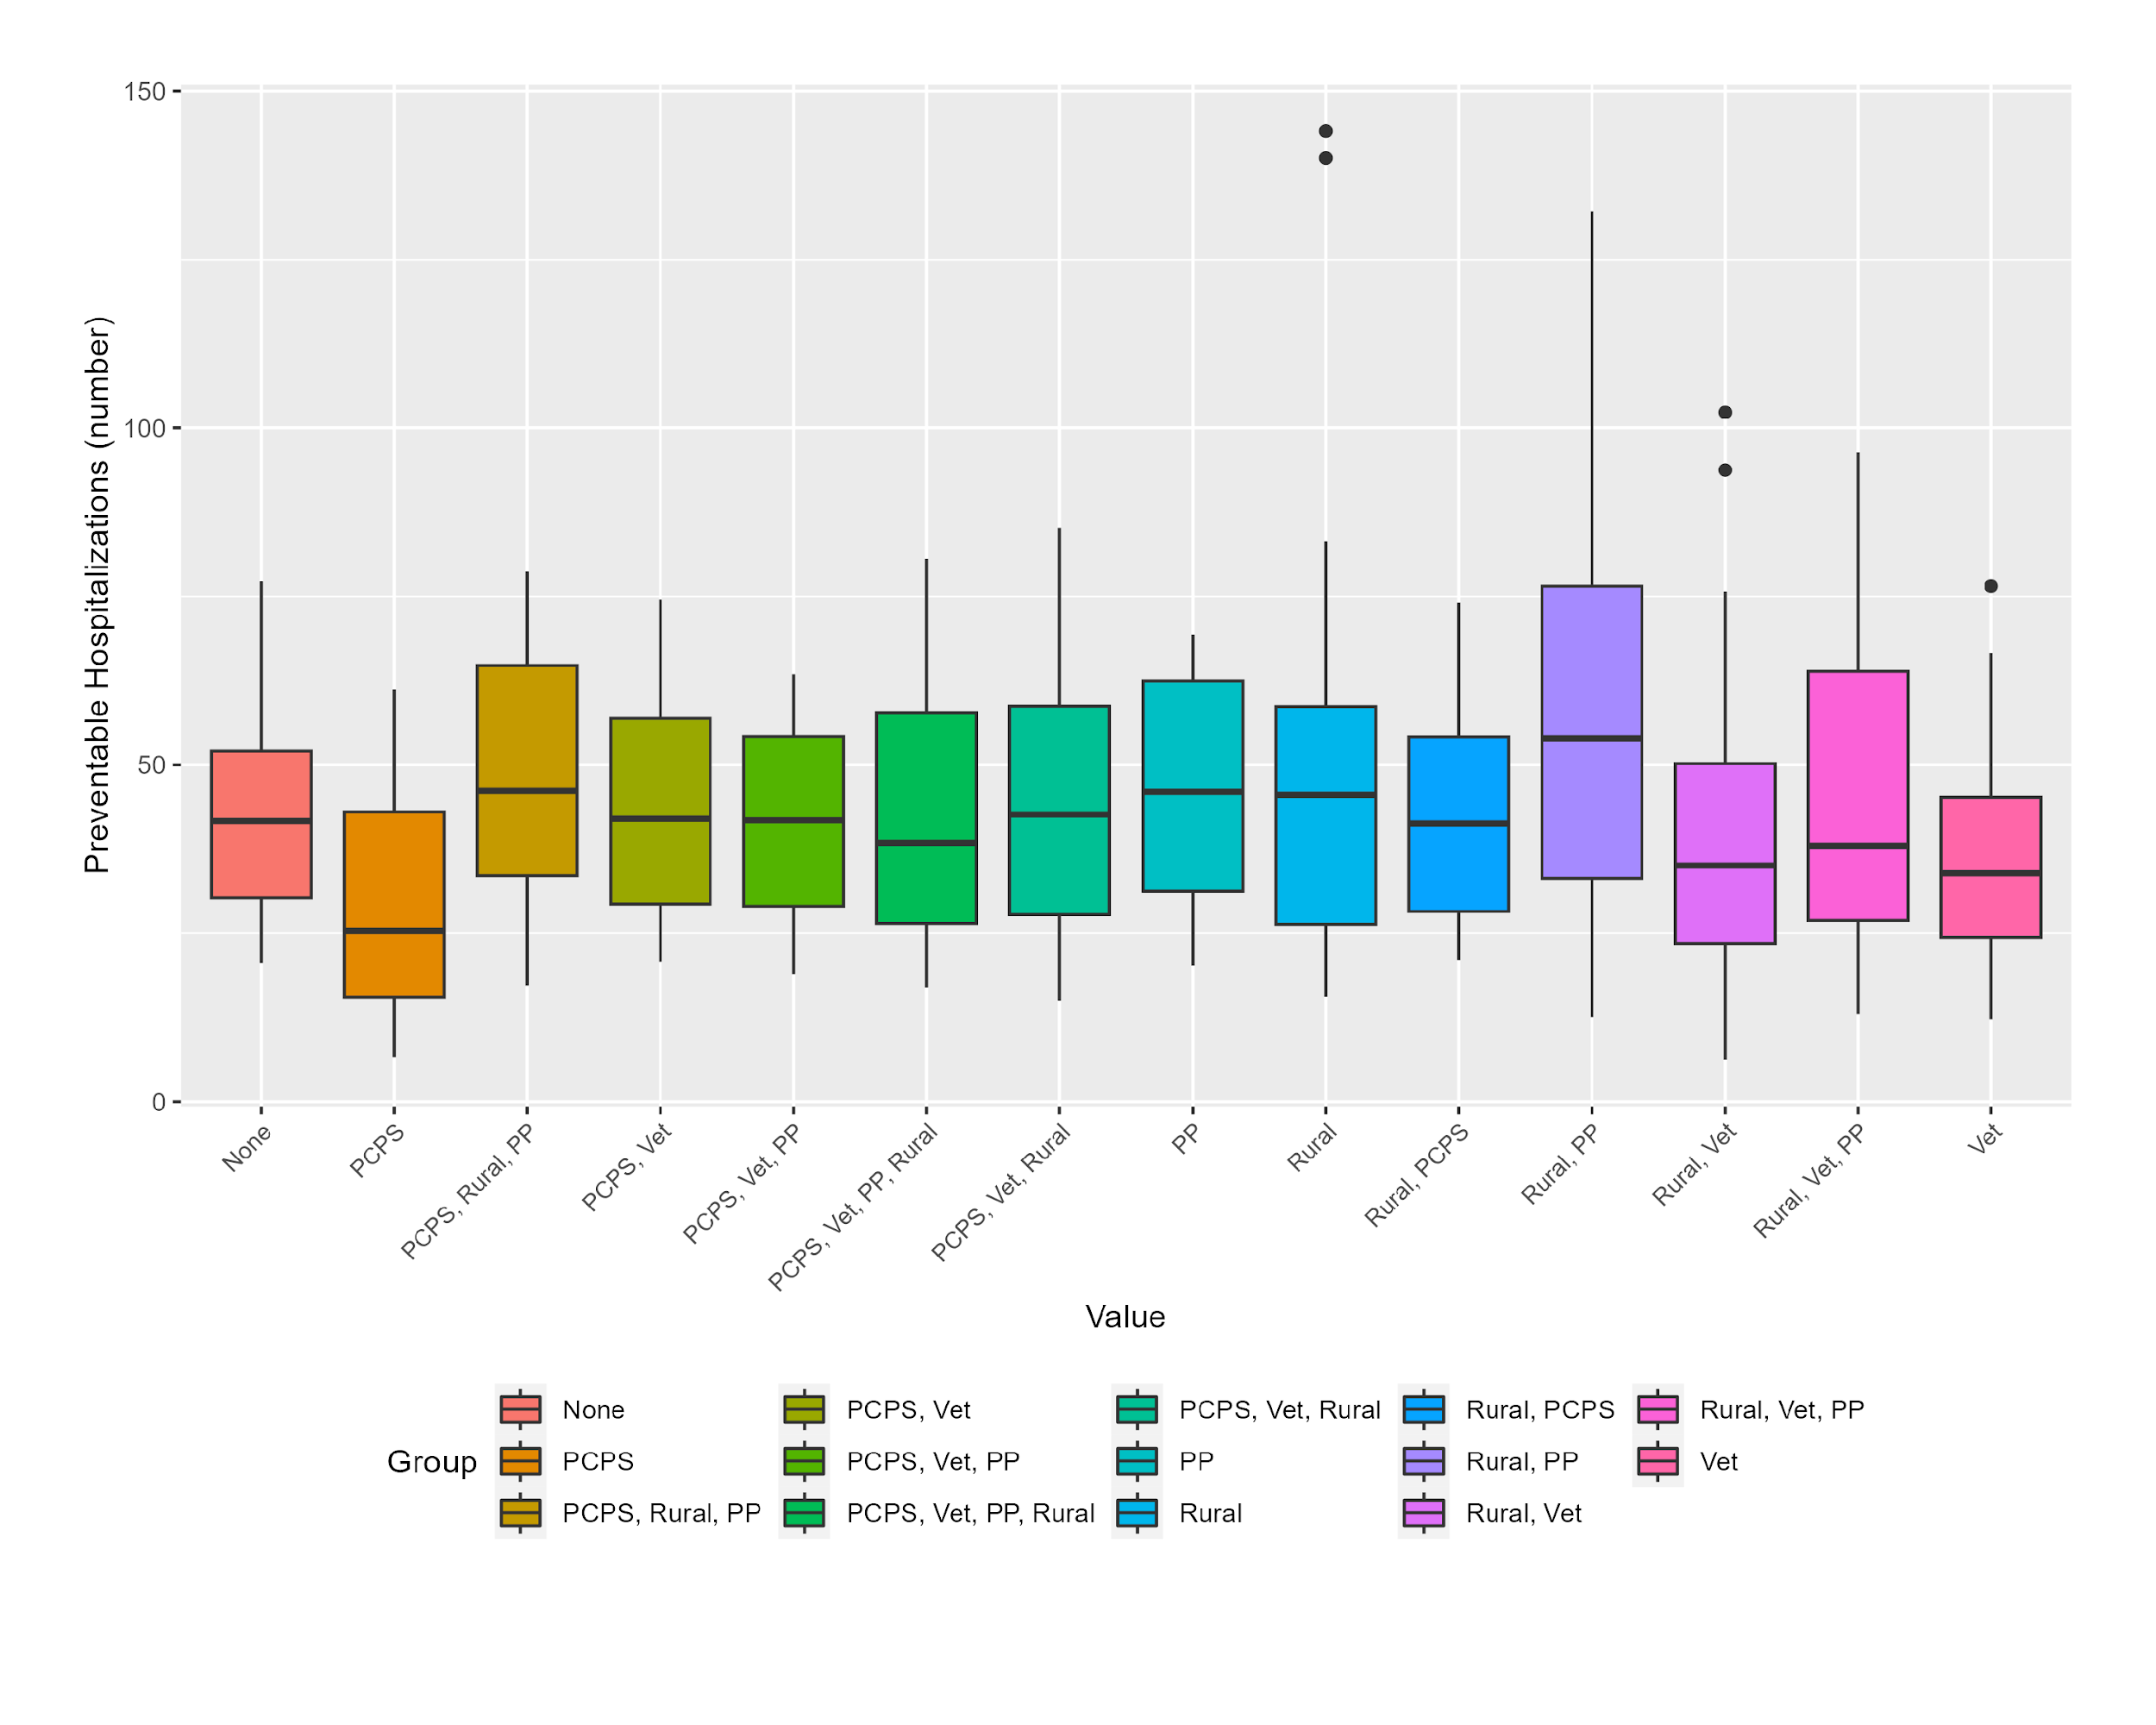
figure-s2d.png
202.8 kBFigure S2D. Figure Caption: Boxplots explore the mean and variance of broadband speed (Mbps) in a county, grouping by county characteristics and averaging across FCC priority counties (N=171) and over time (2013-2020). PCPS: Primary Care Physician Shortage; PP: Persistent Poverty; Vet: Veteran.
SHA-256 550aa521fb8dfb82c5a71f0248cadd2a2500e0b706c285893d5bb44188896807
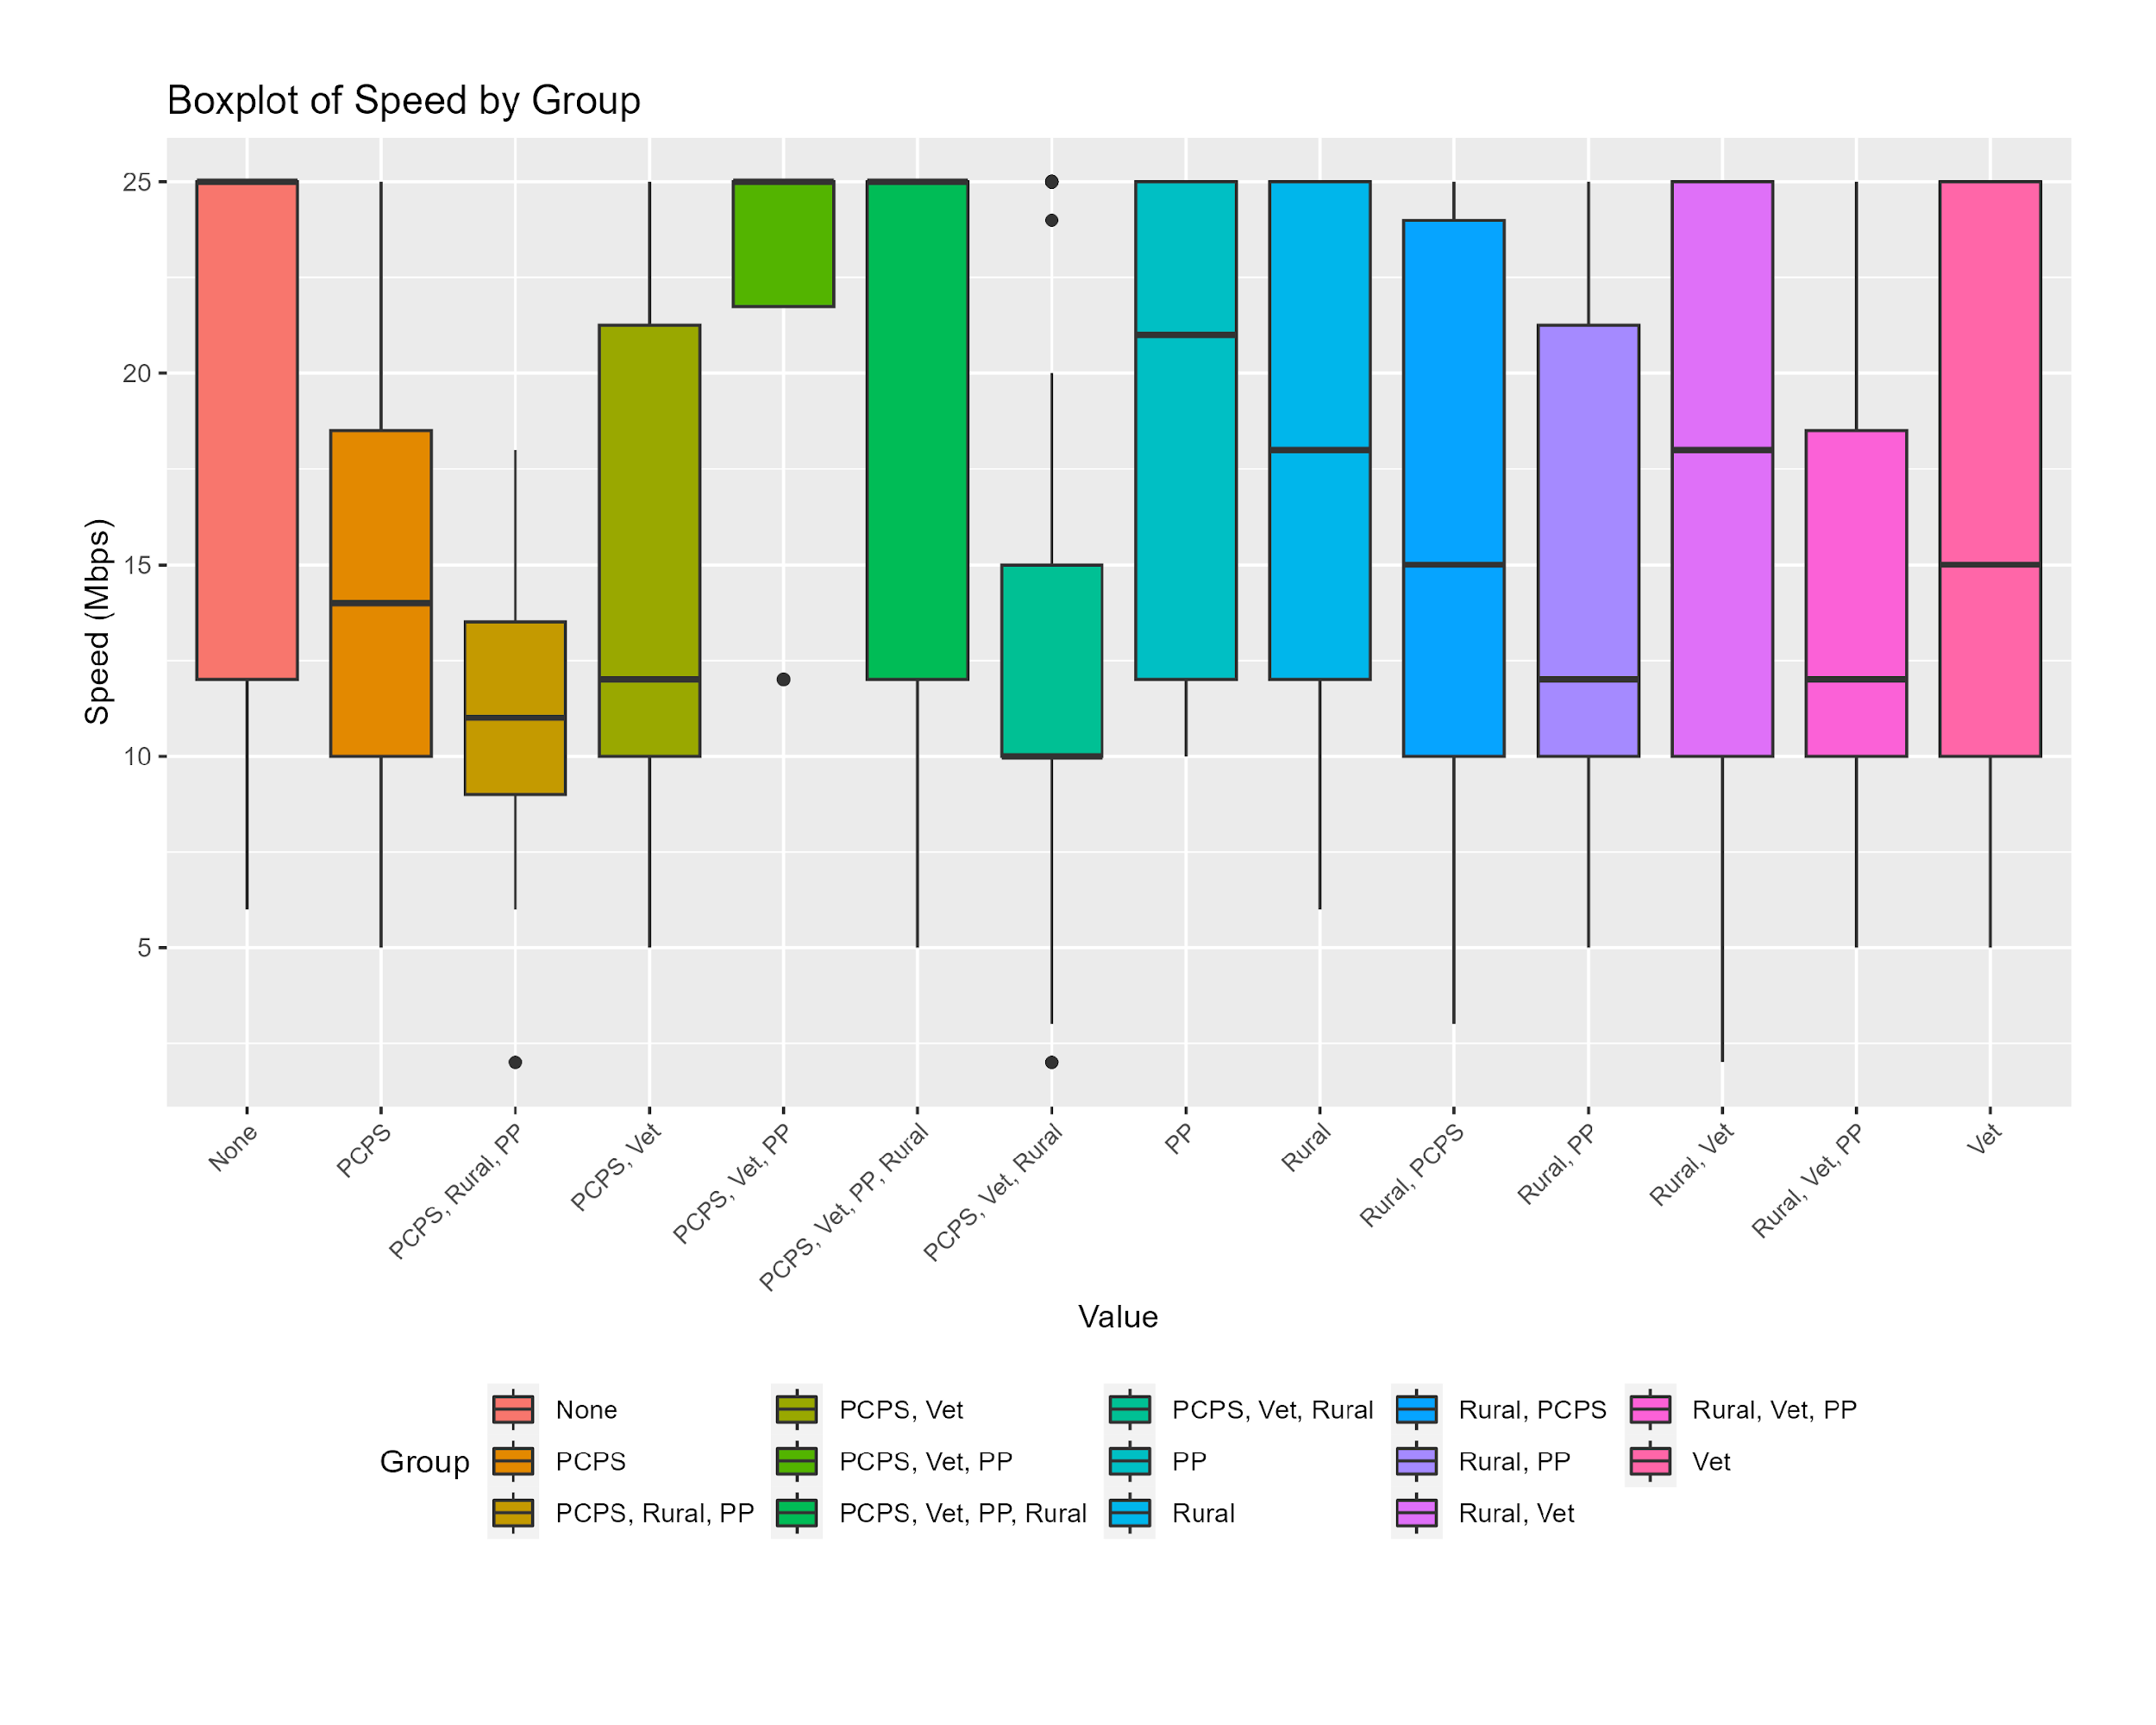
figure-s2e.png
199.7 kBFigure S2E. Figure Caption: Boxplots explore the mean and variance of percent of households in a county with broadband subscriptions, grouping by county characteristics and averaging across FCC priority counties (N=171) and over time (2013-2020). PCPS: Primary Care Physician Shortage; PP: Persistent Poverty; Vet: Veteran.
SHA-256 8dda17768b3224c93ee6de3783d59ed42dac830ab5e0aa2330386a88b13f5391
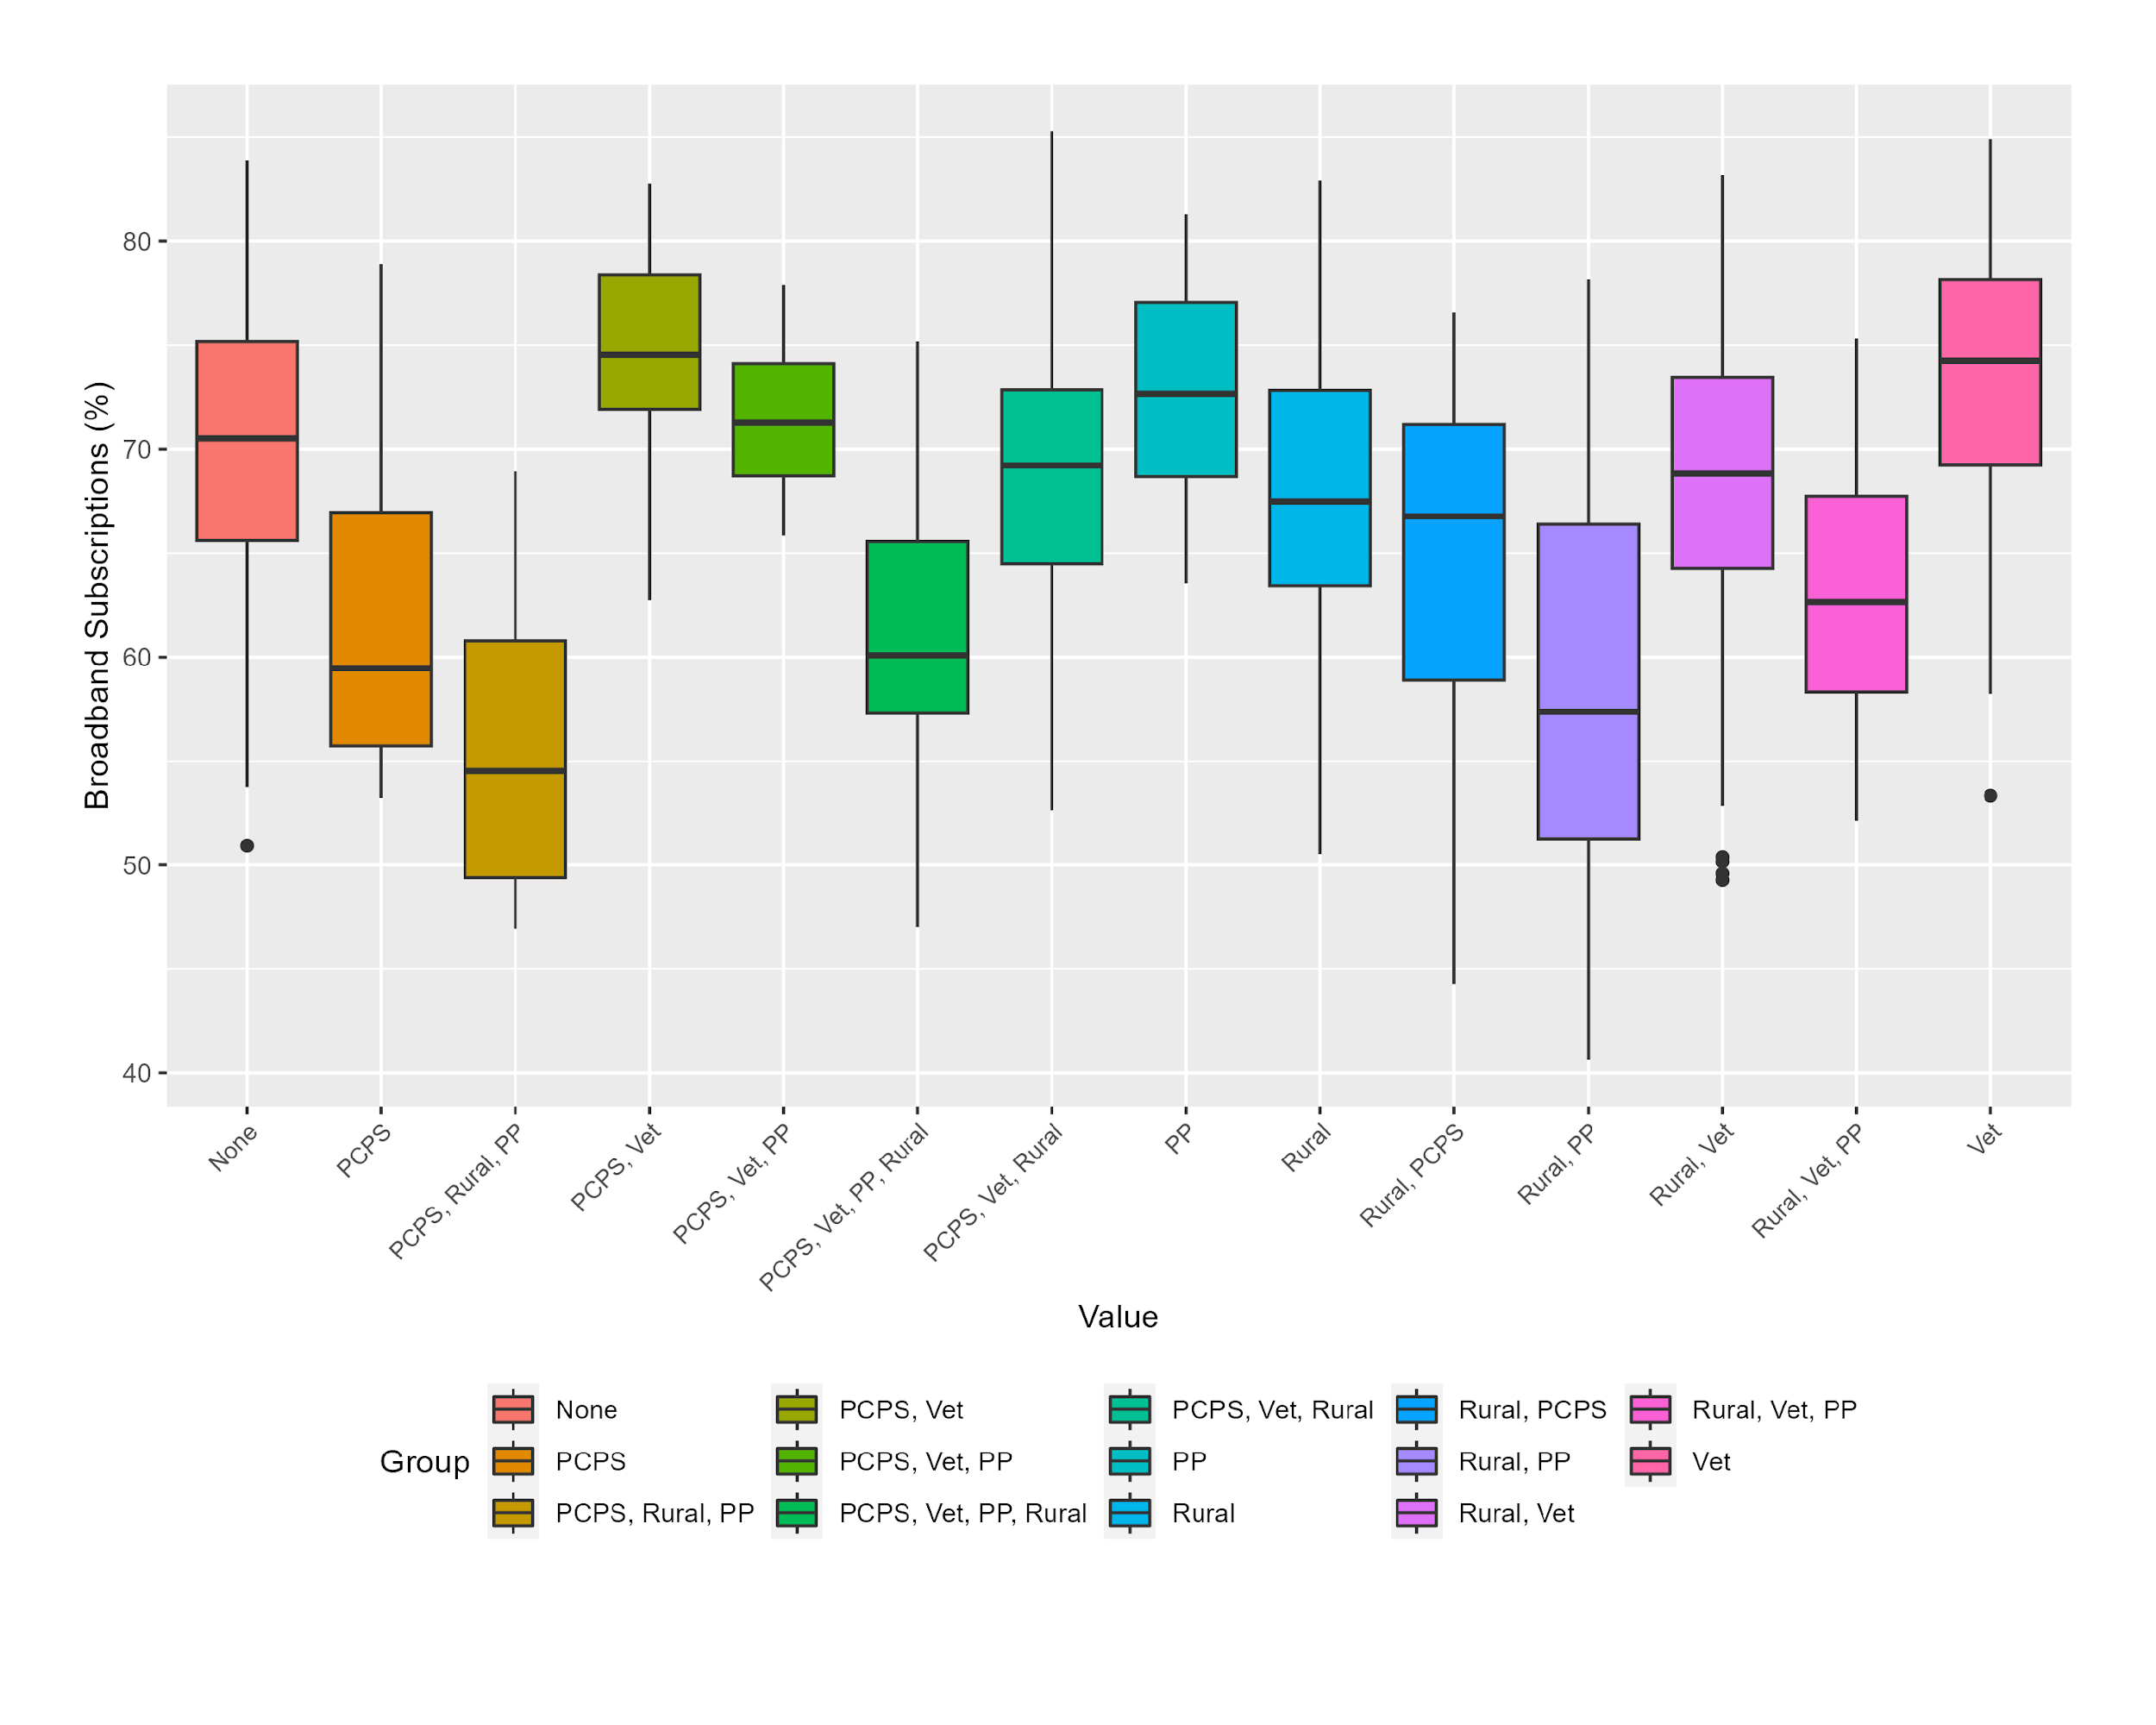
figure-s2f.png
193.8 kBFigure S2F. Figure Caption: Boxplots explore the mean and variance of percent of households in a county with advanced broadband speeds (> 25 Mbps), grouping by county characteristics and averaging across FCC priority counties (N=171) and over time (2013-2020). PCPS: Primary Care Physician Shortage; PP: Persistent Poverty; Vet: Veteran.
SHA-256 930b7bc9f3c2d8d19d9e2f454085fa72401555b5b469e0df73ee1133d4f44139
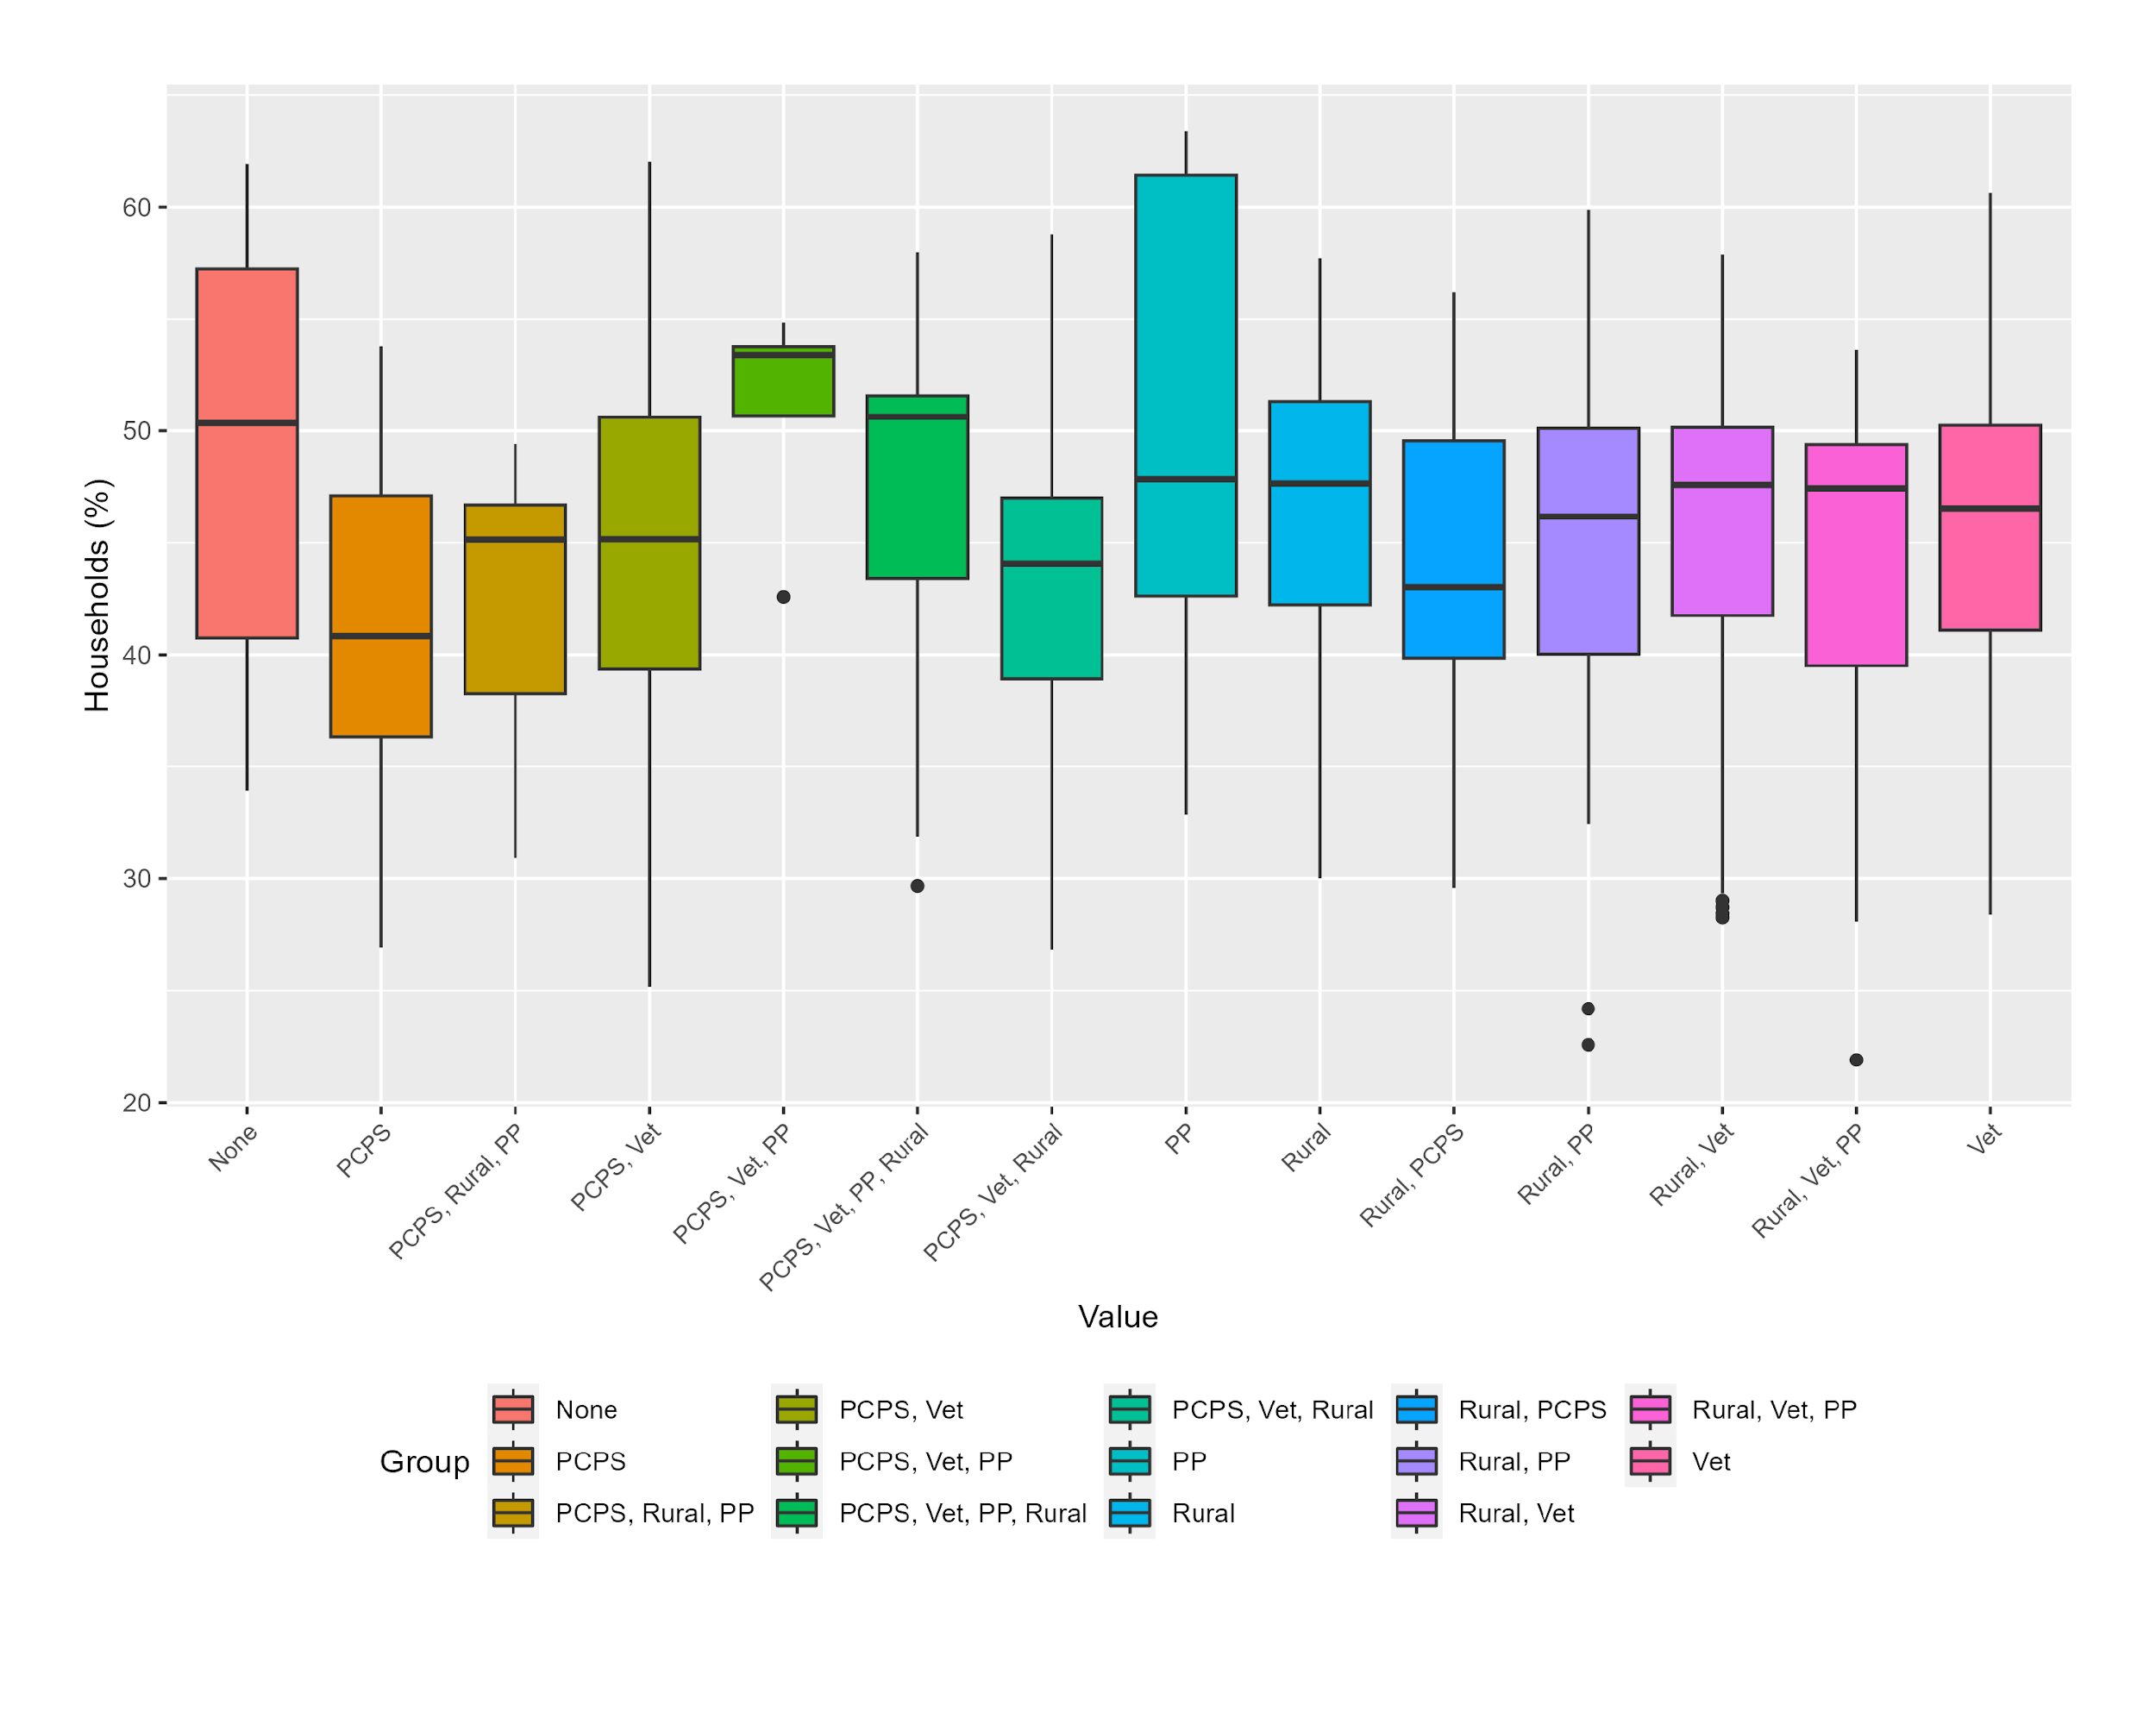
table-s1.csv
1.2 kBTable S1. Sensitivity analyses of relationships between broadband and health outcomes over time (2013-2020) in FCC priority counties including potential outliers (N=187), controlling for county-level characteristics.
SHA-256 8f54fd0224fb67cd009f7f38798b990f20b86413f1dc0e85e788ce6d34cee723
data_dictionary.csv
4.2 kBWhat each table and figure file contains.
SHA-256 f70b961c372d4b08defc083165839cf15a342368ea0b62aad2582b0735286c9d
README.md
5.8 kBContents, how to read the tables, license and citation.
SHA-256 571321c3d4edfbf15ab37ee30b0a485fd31e3ff688d41e312206fec067c53629
METHODS.md
1.1 kBSource manuscript, how the tables and figures were copied, captions and checks.
SHA-256 0a5752311e7c9582dcd07bd11fc10973114922dfba23d646f29a1e47a050d39c
MANIFEST.json
3.1 kBByte count and SHA-256 for every file in the source release.
SHA-256 563b2d14591163e8e94fe8d21fea46d968011db2eb817a0930a6bab47f70504c
CITATION.cff
1.2 kBDataset citation, creator list and the article it supplements.
SHA-256 b81e3e1a09505c6f8aa426765593c24845617d76b92f5697939a0556961fd29b
LICENSE
18.2 kBCreative Commons Attribution 4.0 International legal code.
SHA-256 9ba9550ad48438d0836ddab3da480b3b69ffa0aac7b7878b5a0039e7ab429411
deposit-receipt.json
4.6 kBDeposit receipt: source release, archive digest and rights.
SHA-256 abf3864afc89308fbc509540848d5b4c586e50c75059811e6f367127f217ae68
How it was made
Methods
- 1
The files come from the final accepted Word manuscript of the article. Each table was copied cell by cell into a UTF-8 CSV file, and each figure is the image embedded in the manuscript, copied byte for byte. No values were retyped, recalculated or generated, and no AI system was used.
- 2
Captions are the caption paragraphs directly above or below each item in the manuscript, copied as written.
- 3
Every file passed ConductScience Data inspection policy 1.2.1 for personal data, secrets and unsafe content. The source manifest fixes all 21 files by byte count and SHA-256, and the archive adds the manifest itself.
Version history
Version 1.0.0 · current
Published September 26, 2026 from source tag v1.0.0 at commit 0a0a1ab2a99f.