


Abstract
The data available to inform public policy for opioid epidemic affected states is often 1-2 years old and cannot address real-time needs. This delay shows the need for a predictive model that can accurately trend fatal drug overdoses and provide a baseline for states to implement evidence based preventative policies for those facing opioid use disorder (OUD).
The Autoregressive Integrated Moving Average (ARIMA) model is a linear regression machine learning model that forecasts future values based on past values of a given time series. We used Auto-ARIMA, a variant of ARIMA designed to automatically optimize predictive model parameters, to forecast overdose deaths in the United States, each U.S. state, and Washington D.C. Our forecasts for the years 2021 and 2022 were based on overdose death data from the year 2015 to 2021 provided by the Vital Statistics Rapid Release (VSSR) program at the Center for Disease Control (CDC).
The ARIMA forecasts predict increasing overdose deaths in the United States and most U.S. States, with some states experiencing a near-doubling of overdose deaths from 2020 to 2022. This abstract represents a preliminary yet invaluable step toward forecasting overdose deaths in real-time on a state-by-state level to measure efficacy of evidence-based policy for addressing this public health crisis.
Keywords: OUD, forecasting, overdose deaths, predictive analytics, ARIMA
Background
Since 1999, nearly 841,000 people in the United States have succumbed to drug overdoses, with over 70% of drug overdose deaths in 2019 involving an opioid [1]Hedegaard, H., Miniño, A.M. and Warner, M., 2020. Drug overdose deaths in the United States, 1999–2018.. Although the total number of drug overdose deaths decreased by 4% from 2017 to 2018, overdose deaths related to synthetic opioids increased by 10% and the overall number of overdose deaths was four times higher in 2018 than in 1999 [2]Hedegaard, H., Miniño, A.M., Spencer, M.R. and Warner, M., 2021. Drug overdose deaths in the United States, 1999–2020.. These trends continued to increase through the most recent 2021 data release. Of the estimated 2.5 million U.S. adults with opioid use disorder in 2021, only 22% received medications for their condition, which include evidence-based opioid agonist treatments such as buprenorphine, methadone, and naltrexone. This highlights a treatment gap in the healthcare services provided for substance use disorders [3]Krawczyk, N., Rivera, B.D., Jent, V., Keyes, K.M., Jones, C.M. and Cerdá, M., 2022. Has the treatment gap for opioid use disorder narrowed in the US?: A yearly assessment from 2010 to 2019”.,[4]Dowell, D., 2024. Treatment for opioid use disorder: population estimates—United States, 2022.. Furthermore, of those needing treatment for substance use disorder, very few can access it [5]American Society of Addiction Medicine (2024) Engagement and Retention of Nonabstinent Patients in Substance Use Treatment: Clinical Consideration for Addiction Treatment Providers.. The opioid epidemic necessitates evidence-based policies, including but not limited to legal consequences such as Good Samaritan laws that protect individuals who report overdoses, as well as a variety of harm reduction initiatives beyond needle exchange programs, such as supervised consumption services and fentanyl test strips. This data, which should include both publicly available preliminary data on overdose-related deaths from the CDC and peer-reviewed research and public reports, is vital for evaluating the effectiveness of these initiatives [6]Blanco, C., Wall, M.M. and Olfson, M., 2022. Data needs and models for the opioid epidemic..
Because of barriers in data processing and quality control, there is a lag in time approximating 6 months to a year from when data is collected to when findings are easily accessible to policy makers [6]Blanco, C., Wall, M.M. and Olfson, M., 2022. Data needs and models for the opioid epidemic.. Thus, the data available to inform public policy is often 1-2 years old and impedes the ability of states to create effective public health policies that address real-time needs. Studies have indicated that a potential solution to this issue may be generation of provisional estimates that can be revised as new data is made available [6]Blanco, C., Wall, M.M. and Olfson, M., 2022. Data needs and models for the opioid epidemic.. Overall, these issues call attention to the need for a predictive, impact-oriented model that can accurately trend fatal overdoses and thereby provide a baseline for state and local governments to implement evidence-based preventative policies. Impact-oriented modeling helps guide health care officials, policy makers, and the public to make informed behavioral health decisions. These models require criteria like accessibility, ease of use, adaptability, transparency, agility, and responsiveness for informed behavioral health decisions [7]Shah, N.R., Lai, D. and Wang, C.J., 2021. An impact-oriented approach to epidemiological modeling..
The AutoRegressive Integrated Moving Average (ARIMA) model is a forecasting method that uses the past values of a time series dataset to predict future values. The ARIMA model consists of an autoregressive model, moving average model, and seasonal autoregressive integrated moving average model [8]Shuja, J., Alanazi, E., Alasmary, W. and Alashaikh, A., 2021. COVID-19 open source data sets: a comprehensive survey.. Its application is favored in various analytical scenarios due to its proficiency in analyzing data characteristics and its reliability in yielding predictions with limited variance, a feature that is particularly advantageous when addressing questions pertinent to public health [9]Su, Z., Li, W., Sun, Y. and Guo, P., 2020. A time prediction model for residents consumption level based on ARIMA and PCA.. The model has been used epidemiologically in various diseases and medical conditions, for example, by predicting incidence and location of various infectious diseases such as COVID-19 [10]Benvenuto, D., Giovanetti, M., Vassallo, L., Angeletti, S. and Ciccozzi, M., 2020. Application of the ARIMA model on the COVID-2019 epidemic dataset.,[11]Pourghasemi, H.R., Pouyan, S., Farajzadeh, Z., Sadhasivam, N., Heidari, B., Babaei, S. and Tiefenbacher, J.P., 2020. Assessment of the outbreak risk, mapping and infection behavior of COVID-19: Application of the autoregressive integrated-moving average (ARIMA) and polynomial models.,[12]Singh, R.K., Rani, M., Bhagavathula, A.S., Sah, R., Rodriguez-Morales, A.J., Kalita, H., Nanda, C., Sharma, S., Sharma, Y.D., Rabaan, A.A. and Rahmani, J., 2020. Prediction of the COVID-19 pandemic for the top 15 affected countries: Advanced autoregressive integrated moving , Tuberculosis [13]Wei, W., Jiang, J., Gao, L., Liang, B., Huang, J., Zang, N., Ning, C., Liao, Y., Lai, J., Yu, J. and Qin, F., 2017. A new hybrid model using an autoregressive integrated moving average and a generalized regression neural network for the incidence of tuberculosis in Heng County, China., and Hemorrhagic fever with renal syndrome from Hantavirus [14]Wang, Y.W., Shen, Z.Z. and Jiang, Y., 2019. Comparison of autoregressive integrated moving average model and generalised regression neural network model for prediction of haemorrhagic fever with renal syndrome in China: a time-series study.,[15]Li, Q., Guo, N.N., Han, Z.Y., Zhang, Y.B., Qi, S.X., Xu, Y.G., Wei, Y.M., Han, X. and Liu, Y.Y., 2012. Application of an autoregressive integrated moving average model for predicting the incidence of hemorrhagic fever with renal syndrome.. Furthermore, these applications have shown that ARIMA models can be highly accurate and perform well in public health settings, providing a reliable basis for the current research question [16]Ilie, O.D., Ciobica, A. and Doroftei, B., 2020. Testing the Accuracy of the ARIMA Models in Forecasting the Spreading of COVID-19 and the Associated Mortality Rate.. The model has also been used to predict concussion related medical encounters in Ohio before and after concussion related laws [17]Huang, L., Sullivan, L. and Yang, J., 2020. Analyzing the impact of a state concussion law using an autoregressive integrated moving average intervention analysis., as well as injury mortality in China [18]Lin, Y., Chen, M., Chen, G., Wu, X. and Lin, T., 2015. Application of an autoregressive integrated moving average model for predicting injury mortality in Xiamen, China.. Regarding opioids, the ARIMA model has proven that a real time surveillance program using poison center data would have been able to predict a fentanyl outbreak 1 month prior and can effectively be used to monitor heroin-related exposures [19]Friedman, L.S., 2009. Real-time surveillance of illicit drug overdoses using poison center data.. The ARIMA model has also been used to evaluate racial and ethnic disparities in opioid overdose predictions [20]Friedman, J., Hansen, H., Bluthenthal, R.N., Harawa, N., Jordan, A. and Beletsky, L., 2021. Growing racial/ethnic disparities in overdose mortality before and during the COVID-19 pandemic in California.. The use of the ARIMA model in the above instances has shown to be effective and crucial in making public health predictions and recommendations to manage the prevalence of diseases. A previous study that explored COVID-19 epidemiological ARIMA models also found that such models had great merit in providing a means of data-driven, informed decision-making in the midst of the pandemic, while providing a fundamentally accurate understanding of the potential magnitude and directionality of future viral outbreaks.
ARIMA models have established itself as a standard time-series tool to forecast overdose mortality, often being coupled with other advanced machine learning tools to incorporate real-time data [21]Sumner, S.A., Bowen, D., Holland, K., Zwald, M.L., Vivolo-Kantor, A., Guy Jr, G.P., Heuett, W.J., Pressley, D.P. and Jones, C.M., 2022. Estimating weekly national opioid overdose deaths in near real time using multiple proxy data sources.,[22]Myers, J.V., Marks, C., Kim, J., Fareed, N., Thomas, N., Whitley, P. and Fernandez, S., 2025. Generating Timely Estimates of Overdose Deaths for the US Using Urine Drug Test Data.. Other studies have shown that machine learning algorithms can be useful to implement for opioid risk prediction in individuals [23]Lo-Ciganic, W.H., Huang, J.L., Zhang, H.H., Weiss, J.C., Wu, Y., Kwoh, C.K., Donohue, J.M., Cochran, G., Gordon, A.J., Malone, D.C. and Kuza, C.C., 2019. Evaluation of machine-learning algorithms for predicting opioid overdose risk among medicare beneficiaries with opioid prescriptions., [24]Lo-Ciganic, W.H., Huang, J.L., Zhang, H.H., Weiss, J.C., Kwoh, C.K., Donohue, J.M., Gordon, A.J., Cochran, G., Malone, D.C., Kuza, C.C. and Gellad, W.F., 2020. Using machine learning to predict risk of incident opioid use disorder among fee-for-service Medicare beneficiaries: a prognostic study., but this is focused on use for clinical practice not public policy. This manuscript provides a population-level data forecast of the number of opioid overdose deaths in future years through the use of the ARIMA ML model. This will provide useful, effective information for designing statewide public health policies.
Objective
The primary objective of this study is to delineate the temporal trends of drug overdose deaths across the United States and to forecast future incidents using an ARIMA model, utilizing publicly available CDC data from 2015 to 2021. The analysis will include stratifications by state and key demographics to pinpoint regional and population-specific trends. Our second aim is to validate the ARIMA model's forecasts by contrasting them with actual CDC data from the same study period, ensuring the model's reliability for predicting future trends in drug overdose deaths.
Methods
Data Description
The first dataset used in this study was the annual drug overdose mortality statistics sourced from the Center for Disease Control and Prevention (CDC)’s National Center for Health Statistics (NCHS) from 2015 to 2021 inclusive. The CDC NCHS Vital Statistics Rapid Release program provides the most up-to-date quantitative information about drug-related overdoses in the United States. Their data from the years 2015 to 2021 was amenable to time series analysis using ARIMA on a national and state level, but not machine learning techniques, due to a paucity of data. The second dataset used in this study was the total population data sourced from the United States Census Bureau. In both the drug overdose mortality dataset and the total population dataset, the number of people was stratified based on each of the 50 U.S. states and the District of Columbia.
The data for each territory was formatted as a rolling, monthly accumulation of the previous 12-month period. We used Auto-ARIMA to determine the most predictive ARIMA parameters for forecasting overdose deaths in the United States, each U.S. state, and Washington D.C. Because this data was public and/or de-identified data, the study did not constitute human subjects research, and therefore the institutional ethical review board considered the research exempt from IRB requirements.
Model Design
Our initial dataset consisted of total overdose deaths for 52 distinct regions, including the United States, each of the 50 U.S. States, and Washington D.C. The data for each territory was formatted as a rolling, monthly accumulation of the previous 12-month period. For example, one data point in a time series could represent all overdose deaths from January 2015 to December 2015, and the next data point in the series would represent all overdose deaths from February 2015 to January 2016.
We forecasted mortality rates for the years 2021 (ie, January 2021 to December 2021) and 2022 (ie, January 2022 to December 2022) by applying ARIMA to each of these territories’ time series data, for a total of 52 time series analyses. An ARIMA model requires three parameters: p, d, and q, with p representing the number of autoregressive terms, d representing the order of differencing required to achieve stationary data, and q representing the number of lagged forecast errors. In the classic ARIMA model, the p,d, and q term values need to be provided, and the values with the best fit are used to determine the most accurate model. In Auto-ARIMA, ML statistical techniques are used to generate these values; the model itself will generate the optimal p (number of autoregressive terms), d (number of nonseasonal differences necessary for stationarity), and q (number of lagged forecast errors in the prediction set) values for the data set given with the goal of better forecasting along with time efficiency. The value p is the number of autoregressive terms. We utilized the Auto-ARIMA functionality of the python package pmdarima to programmatically determine the best order of p, d, and q for each of our 52 ARIMA models. The best ARIMA model parameters for each territory are displayed in Supplementary Table 1.
ARIMA was selected over other alternative models, such as SARIMA and Prophet, because the CDC Vital Statistics Rapid Release dataset contains rolling 12-month aggregates (2015-2021), which can limit the utility of models that depend on seasonality. ARIMA often outperforms machine learning models that have limited available data which has less prediction errors and narrower prediction intervals in comparative studies [25]Zhang, R., Song, H., Chen, Q., Wang, Y., Wang, S. and Li, Y., 2022. Comparison of ARIMA and LSTM for prediction of hemorrhagic fever at different time scales in China.,[26]Makridakis, S., Spiliotis, E. and Assimakopoulos, V., 2018. Statistical and Machine Learning forecasting methods: Concerns and ways forward.. LTSM network machine learning models require large training periods, typically 20 weeks or longer, to obtain accurate generalization and extract the computation resources constrained from datasets [25]Zhang, R., Song, H., Chen, Q., Wang, Y., Wang, S. and Li, Y., 2022. Comparison of ARIMA and LSTM for prediction of hemorrhagic fever at different time scales in China.,[27]Wu, R.M., Shafiabady, N., Zhang, H., Lu, H., Gide, E., Liu, J. and Charbonnier, C.F.B., 2024. Comparative study of ten machine learning algorithms for short-term forecasting in gas warning systems.. Prophet requires multiple seasonal cycles that can range from 1-5 years and exogenous covariates [28]McCoy Jr, T.H., Pellegrini, A.M. and Perlis, R.H., 2018. Assessment of time-series machine learning methods for forecasting hospital discharge volume.. SARIMA obscures seasonal patterns in aggregated 12-month rolling totals and has great performance with weekly or month data, but this pre-aggregated structure eliminates the temporal data that provides meaningful seasonal decomposition [29]Wang, Y.B., Qing, S.Y., Liang, Z.Y., Ma, C., Bai, Y.C. and Xu, C.J., 2023. Time series analysis-based seasonal autoregressive fractionally integrated moving average to estimate hepatitis B and C epidemics in China.,[30]Al Mobin, M. and Kamrujjaman, M., 2023. Downscaling epidemiological time series data for improving forecasting accuracy: An algorithmic approach.. In addition, SARIMA has significant fluctuations in aggregated public health data, demonstrating lower accuracy improvements over ARIMA [30]Al Mobin, M. and Kamrujjaman, M., 2023. Downscaling epidemiological time series data for improving forecasting accuracy: An algorithmic approach.. Comparative literature has shown ARIMA to be inferior in datasets with longer time series with available higher resolutions, conditions not met in this dataset. Thus, ARIMA was the best possible model based on its structure, temporal resolution, and length of the available CDC dataset.
Analysis
The number of projected deaths for each territory was combined with yearly United States Census Bureau population data for each corresponding territory to produce an overdose death rate, calculated as the number of overdose deaths per 100,000 residents, to account for changing population sizes over time. The projected values were then compared to actual released CDC 2021 data and a root-mean-square error (RMSE) was calculated. RMSE compares predicted and known values and represents the concentration of data around the line of best fit. Therefore, a small RMSE indicates a lower difference between predicted and observed values. The range of the RMSE value is contingent on the dependent variable (actual deaths).
Results
Overall, the U.S. had 107,521 actual deaths and 128,093.2 projected deaths from 2020 to 2021, and a projected 179,889 deaths from 2020 to 2022. The benchmark between the actual and ARIMA projections and associated root-mean-square error (RMSE) of the ARIMA model projections from 2015-2021 are shown in Table 1. We noted that ARIMA model showed variance in the root mean squared error metric used to measure projection error across the different United States regions, see Supplementary Figure 1. To further support the validity of the ARIMA model, we observed a high correlation between the projected number of drug overdose deaths per 100,000 people in 2021 when modelled using 2015-2020 data compared to the actual number of drug overdose deaths per 100,000 people in 2021 (r = 0.957, p=0.00), see Figure 1A. Moreover, we observed that the actual rate of drug overdose deaths for several regions fell within the range of the ARIMA projected value 土 RMSE in 2021, see Figure 1B.
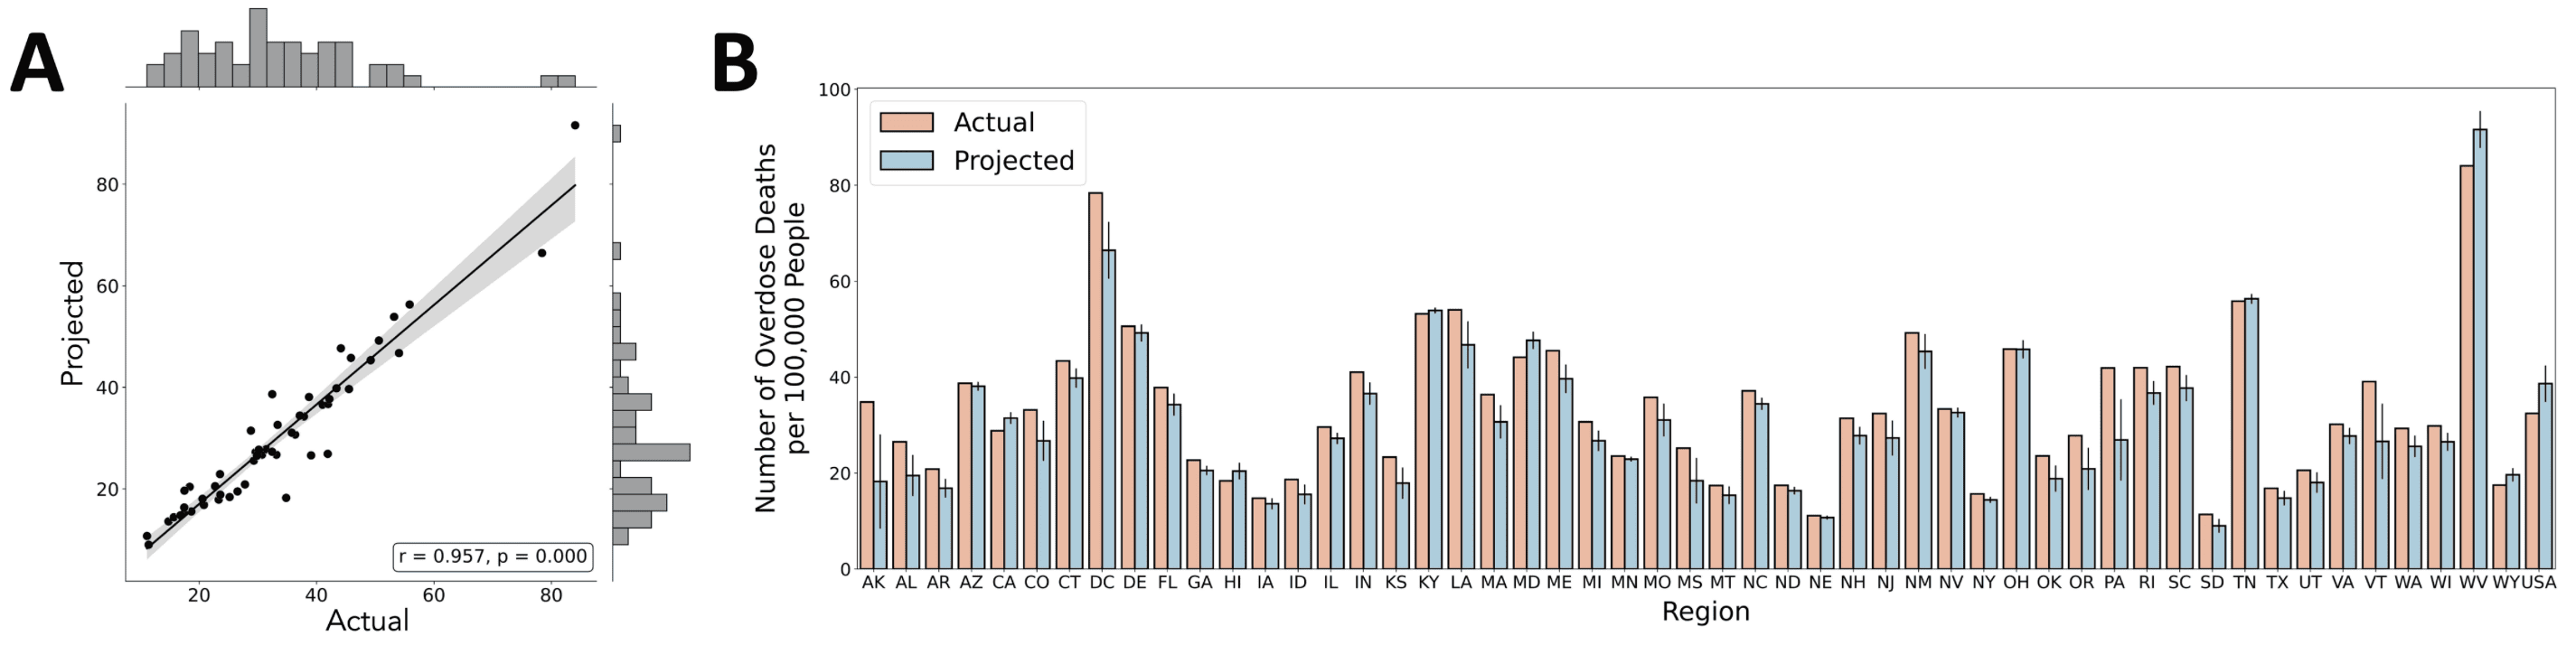
Figure 1. Benchmark of ARIMA model projections and actual drug overdose death rate per 100,000 people across the United States in 2021. A) Projections of drug overdose deaths per 100,000 people using the proposed ARIMA model are highly correlated with actual drug overdose deaths per 100,000 people in 2021 (r = 0.957, p=0.00). B) ARIMA model projection with associated RMSE compared to actual number of overdose deaths per 100,000 people.
Next, we observed an increasing trend of the total number of drug overdose deaths in the United States from 2015-2021 as shown in Figure 2A. The 2021 projection of the total number of drug overdose deaths using the ARIMA model is higher than the actual number of deaths. Using a hierarchical clustering analysis, we identified 4 major groups of regions separated based on differences in trends of the number of drug overdose deaths from 2015-2021 (actual) and 2022 (projected), see Figure 2B. The ARIMA forecasts predict increasing overdose deaths in the United States and most U.S. states, with some regions experiencing a near-doubling of overdose deaths from 2020 to 2022. The number of actual deaths from 2015 to 2021, projected deaths from 2021 to 2022, and projected death rates for 2021 and 2022 are shown in Supplementary Table 2.
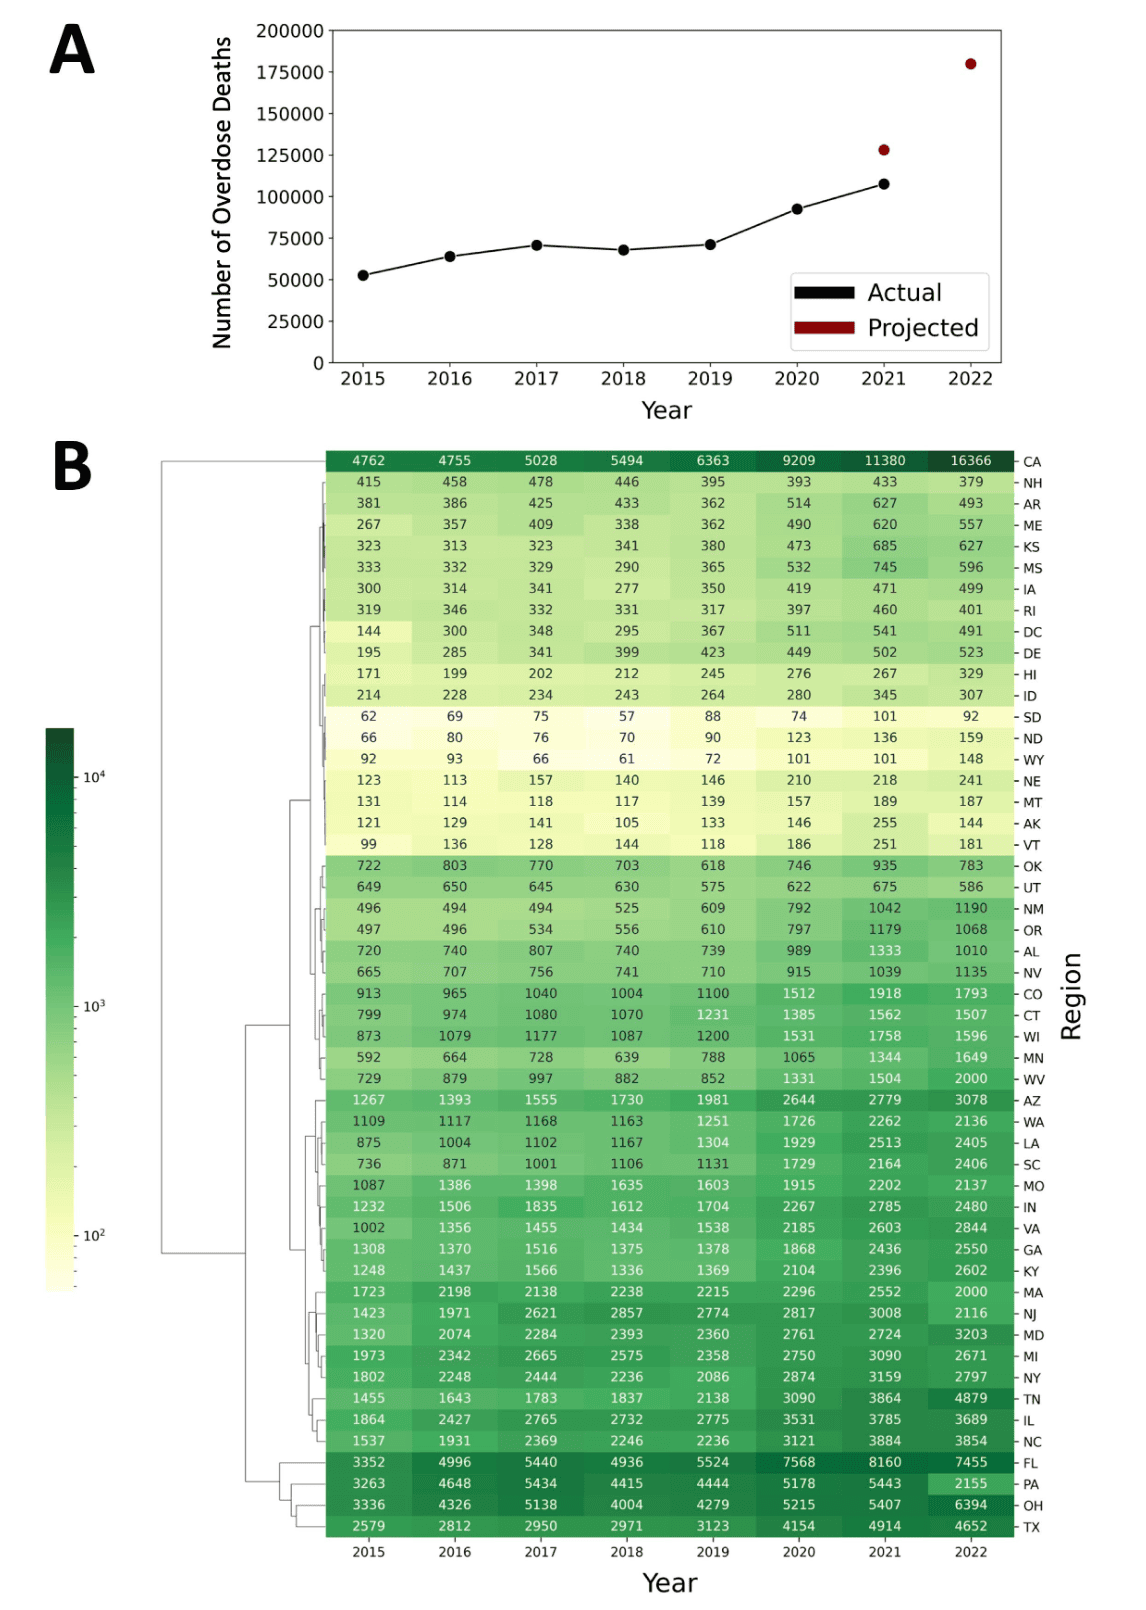
Figure 2. Annual drug overdose deaths across the United States from 2015 to 2022. A) Lineplot of the total number of drug overdose deaths in the United States from 2015-2021 (actual numbers shown in black) and 2021-2022 (projected numbers shown in red). B) Clustered heatmap of the number of drug overdose deaths from 2015-2021 (actual) and 2022 (projected using ARIMA model) across different regions of the United States.
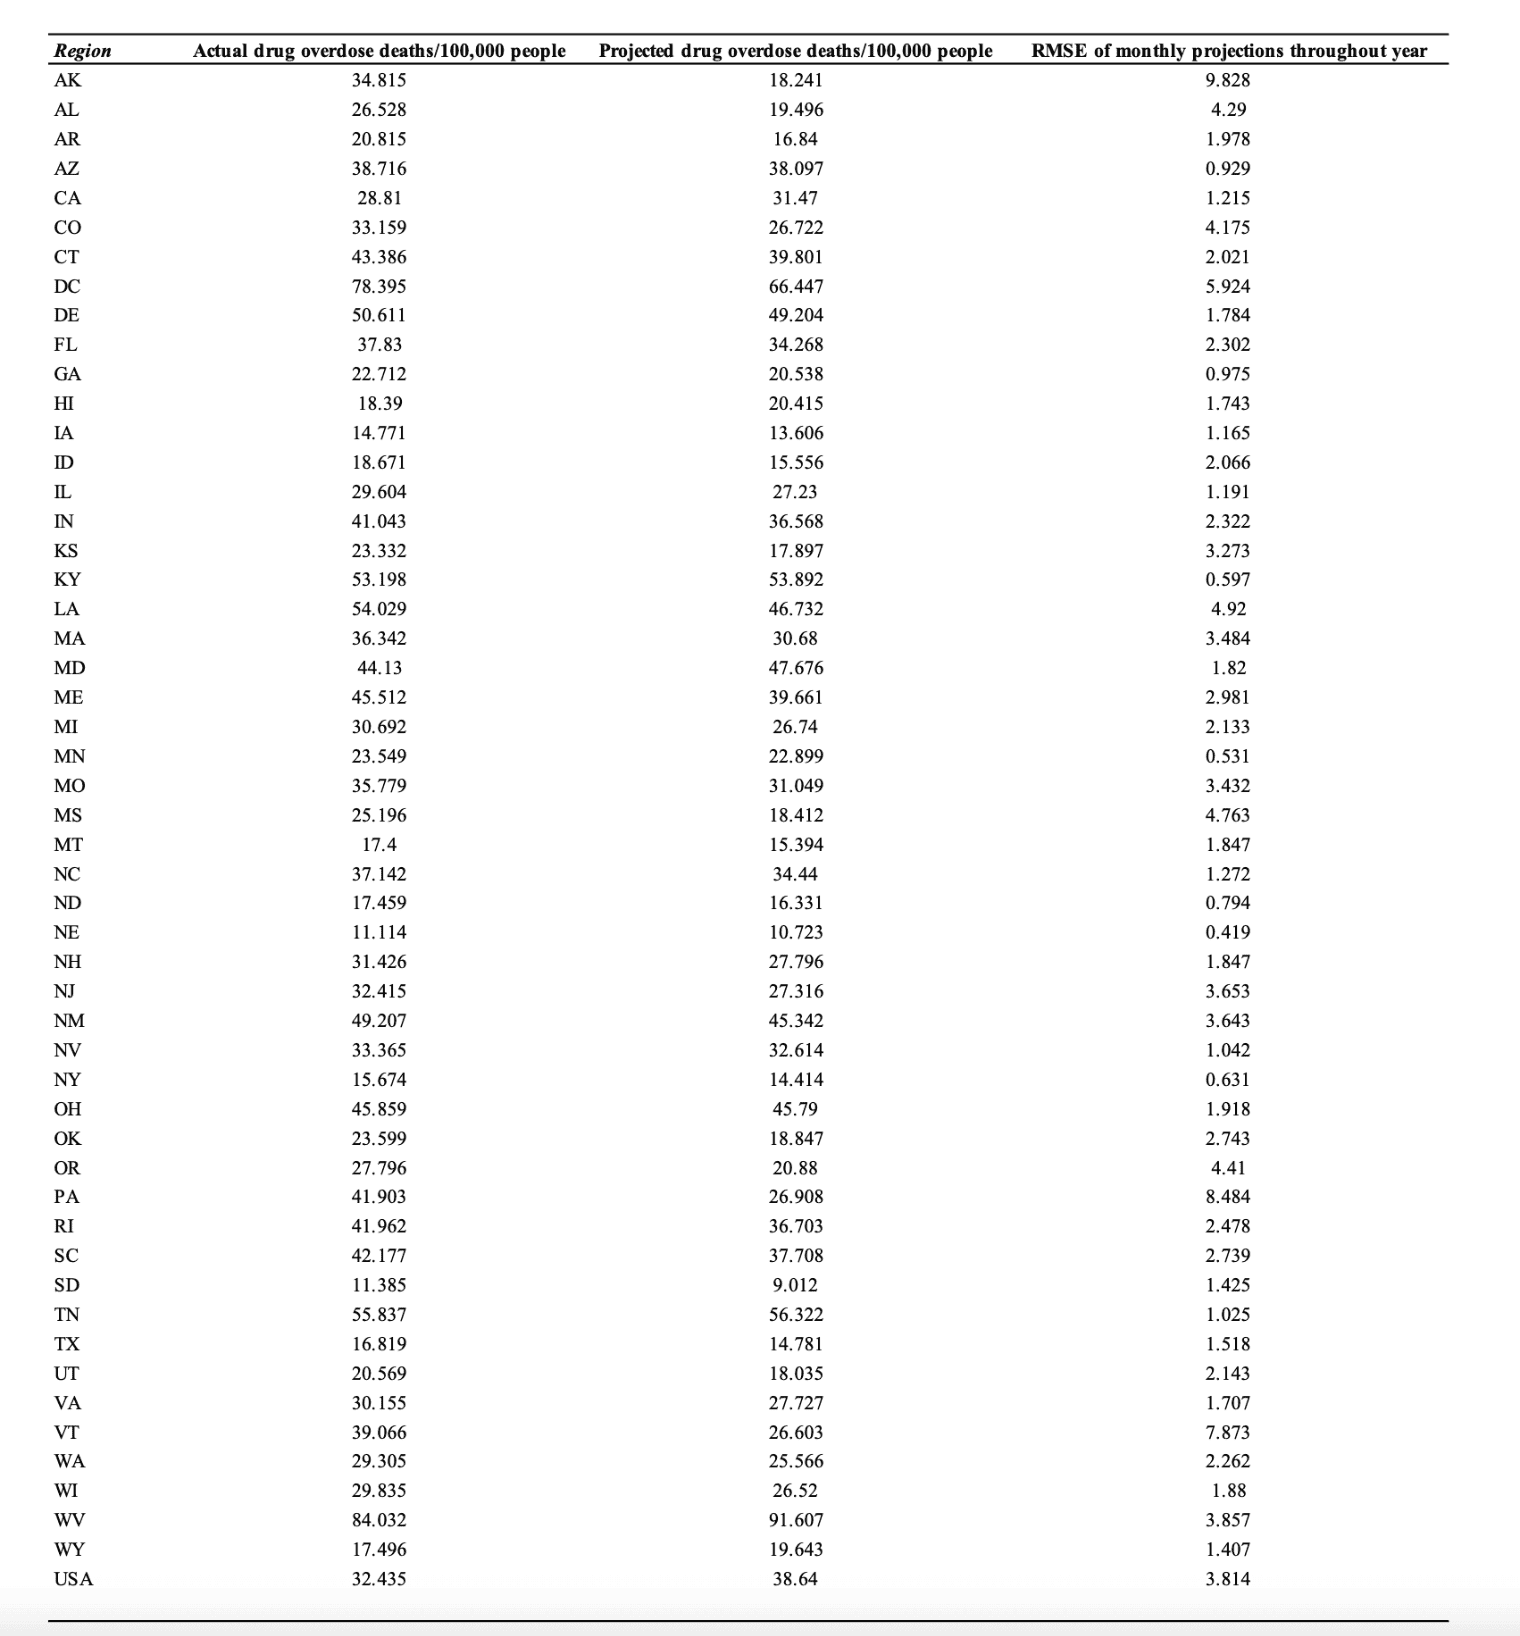
Table 1. The actual number of drug overdose deaths per 100,000 people compared to the projected number of drug overdose deaths per 100,000 people using the ARIMA model. Root mean squared error (RMSE) is shown for each ARIMA projected value as a measure of prediction error.
Discussion
The ARIMA model and data presented in this manuscript represent a preliminary yet invaluable step toward forecasting overdose deaths and baseline modeling data to measure efficacy of evidence-based policy designed to address this public health crisis. Using a data modeling approach, this manuscript attempts to address the lack of real-time overdose death estimates. Overall the ARIMA model overestimated overdose deaths compared to the actual deaths released by the CDC and logistic regression. This may be because time series modeling approaches make predictions based on trends in historical data, and therefore are not always efficient in predicting quick or unanticipated changes in data trends. In addition, we noted that the ARIMA model may tend to be more error-prone in projecting overdose deaths for some regions. We purport that these region-specific errors may be due to potential outlier data in the time series that may make it difficult to accurately project future values using historical trends.
Our data in state-level stratification revealed heterogeneity in baseline overdose mortality and projected growth rates, which underscores the nature of the opioid epidemic in America. Regions in close proximately have similar characteristics such as limitations to accessible healthcare, substance availability, and policy structures, representing local social and policy influences rather than national. Demographic stratification was beyond the modeling framework’s scope, thus, future analysis should include age, race/ethnicity, and other socioeconomic variables.
ARIMA models have been widely used to forecast overdose mortality trends, however, recent studies demonstrate that classical time series approaches have limitations in modeling rapid trend shifts, calling for the need to develop machine learning tools that incorporate real-time proxy data sources [21]Sumner, S.A., Bowen, D., Holland, K., Zwald, M.L., Vivolo-Kantor, A., Guy Jr, G.P., Heuett, W.J., Pressley, D.P. and Jones, C.M., 2022. Estimating weekly national opioid overdose deaths in near real time using multiple proxy data sources.,[31]Cartus, A.R., Li, Y., Macmadu, A., Goedel, W.C., Allen, B., Cerdá, M. and Marshall, B.D., 2022. Forecasted and observed drug overdose deaths in the US during the COVID-19 pandemic in 2020.. Additionally, studies have used the ARIMA model to predict national trends, but not state by state projections [21]Sumner, S.A., Bowen, D., Holland, K., Zwald, M.L., Vivolo-Kantor, A., Guy Jr, G.P., Heuett, W.J., Pressley, D.P. and Jones, C.M., 2022. Estimating weekly national opioid overdose deaths in near real time using multiple proxy data sources.. Other studies have used best-approximated values, instead of machine learning [20]Friedman, J., Hansen, H., Bluthenthal, R.N., Harawa, N., Jordan, A. and Beletsky, L., 2021. Growing racial/ethnic disparities in overdose mortality before and during the COVID-19 pandemic in California.. This model can be used to monitor overdose deaths instantaneously and evaluate the effectiveness of public health interventions swiftly. Being able to understand and predict the changing fatal opioid overdose dynamics through machine learning can be critical to guiding public policy for state and federal governments. This form of data is valuable because it is both reliable and objective as a measurement of overdose deaths. In addition, we noted four major clusters of regions based on shared trends in the time series of annual overdose deaths (both actual and projected values). Further research to determine the associated factors, such as public health policies and availability of healthcare resources, that contribute to similarities and differences in time series forecasts of overdose deaths for different regions may inform future policy-making.
One limitation of the ARIMA model is that it needs to be updated frequently to increase precision and maintain accuracy since due to its application of being a short-time forecast model for incidence rates. Since ARIMA is a single-factor model that only analyzes the time factor, other factors that can affect opioid overdose rates such as changes in opioid availability, street preparations, social norms, and political climate are not adjusted for in this model. Another limitation is that ARIMA accounts for mortality data while overlooking morbidity and other associated pathologies that are associated with OUD deaths such as sepsis, bacteremia, chronic diseases, and behavioral health disorders. This study relies on CDC overdose mortality data which can be affected by misclassification of overdose deaths, reporting delays, and undercounting. This can cause conservative or inflated estimates of various areas and influence the projects derived from the dataset. However, sine ARIMA utilizes temporal continuity over absolute counts, systematic reporting biases will affect magnitude and not the trend itself.
Future studies can focus on further statistical comparison of predictions from the ARIMA model with existing CDC data as it becomes available. Furthermore, this model can be compared with other prediction models to further evaluate the accuracy of this method. The authors strongly suggest more advanced modeling work with additional data sources in the future to better predict OUD deaths and create targeted interventions such as encouraging Buprenorphine prescribers and resources in high mortality areas.
References
- Hedegaard, H., Miniño, A.M. and Warner, M., 2020. Drug overdose deaths in the United States, 1999–2018. NCHS data brief, no 356. Hyattsville, MD: US Department of Health and Human Services, CDC. National Center for Health Statistics
- Hedegaard, H., Miniño, A.M., Spencer, M.R. and Warner, M., 2021. Drug overdose deaths in the United States, 1999–2020.
- Krawczyk, N., Rivera, B.D., Jent, V., Keyes, K.M., Jones, C.M. and Cerdá, M., 2022. Has the treatment gap for opioid use disorder narrowed in the US?: A yearly assessment from 2010 to 2019”. International Journal of Drug Policy, 110, p.103786.
- Dowell, D., 2024. Treatment for opioid use disorder: population estimates—United States, 2022. MMWR. Morbidity and Mortality Weekly Report, 73.
- American Society of Addiction Medicine (2024) Engagement and Retention of Nonabstinent Patients in Substance Use Treatment: Clinical Consideration for Addiction Treatment Providers. ASAM. Available at: https://downloads.asam.org/sitefinity-production-blobs/docs/default-source/guidelines/asam_engagement-and-retention-of-nonabstinent-patients_final_082624.pdf
- Blanco, C., Wall, M.M. and Olfson, M., 2022. Data needs and models for the opioid epidemic. Molecular psychiatry, 27(2), pp.787-792.
- Shah, N.R., Lai, D. and Wang, C.J., 2021. An impact-oriented approach to epidemiological modeling. Journal of General Internal Medicine, 36(6), pp.1765-1767.
- Shuja, J., Alanazi, E., Alasmary, W. and Alashaikh, A., 2021. COVID-19 open source data sets: a comprehensive survey. Applied Intelligence, 51(3), pp.1296-1325.
- Su, Z., Li, W., Sun, Y. and Guo, P., 2020. A time prediction model for residents consumption level based on ARIMA and PCA. In MATEC Web of Conferences (Vol. 309, p. 05009). EDP Sciences.
- Benvenuto, D., Giovanetti, M., Vassallo, L., Angeletti, S. and Ciccozzi, M., 2020. Application of the ARIMA model on the COVID-2019 epidemic dataset. Data in brief, 29, p.105340.
- Pourghasemi, H.R., Pouyan, S., Farajzadeh, Z., Sadhasivam, N., Heidari, B., Babaei, S. and Tiefenbacher, J.P., 2020. Assessment of the outbreak risk, mapping and infection behavior of COVID-19: Application of the autoregressive integrated-moving average (ARIMA) and polynomial models. Plos one, 15(7), p.e0236238.
- Singh, R.K., Rani, M., Bhagavathula, A.S., Sah, R., Rodriguez-Morales, A.J., Kalita, H., Nanda, C., Sharma, S., Sharma, Y.D., Rabaan, A.A. and Rahmani, J., 2020. Prediction of the COVID-19 pandemic for the top 15 affected countries: Advanced autoregressive integrated moving
- Wei, W., Jiang, J., Gao, L., Liang, B., Huang, J., Zang, N., Ning, C., Liao, Y., Lai, J., Yu, J. and Qin, F., 2017. A new hybrid model using an autoregressive integrated moving average and a generalized regression neural network for the incidence of tuberculosis in Heng County, China. The American Journal of Tropical Medicine and Hygiene, 97(3), p.799.
- Wang, Y.W., Shen, Z.Z. and Jiang, Y., 2019. Comparison of autoregressive integrated moving average model and generalised regression neural network model for prediction of haemorrhagic fever with renal syndrome in China: a time-series study. BMJ open, 9(6), p.e025773.
- Li, Q., Guo, N.N., Han, Z.Y., Zhang, Y.B., Qi, S.X., Xu, Y.G., Wei, Y.M., Han, X. and Liu, Y.Y., 2012. Application of an autoregressive integrated moving average model for predicting the incidence of hemorrhagic fever with renal syndrome. The American journal of tropical medicine and hygiene, 87(2), p.364.
- Ilie, O.D., Ciobica, A. and Doroftei, B., 2020. Testing the Accuracy of the ARIMA Models in Forecasting the Spreading of COVID-19 and the Associated Mortality Rate. Medicina, 56(11), p.566.
- Huang, L., Sullivan, L. and Yang, J., 2020. Analyzing the impact of a state concussion law using an autoregressive integrated moving average intervention analysis. BMC health services research, 20(1), p.898.
- Lin, Y., Chen, M., Chen, G., Wu, X. and Lin, T., 2015. Application of an autoregressive integrated moving average model for predicting injury mortality in Xiamen, China. BMJ open, 5(12), p.e008491.
- Friedman, L.S., 2009. Real-time surveillance of illicit drug overdoses using poison center data. Clinical Toxicology, 47(6), pp.573-579.
- Friedman, J., Hansen, H., Bluthenthal, R.N., Harawa, N., Jordan, A. and Beletsky, L., 2021. Growing racial/ethnic disparities in overdose mortality before and during the COVID-19 pandemic in California. Preventive medicine, 153, p.106845.
- Sumner, S.A., Bowen, D., Holland, K., Zwald, M.L., Vivolo-Kantor, A., Guy Jr, G.P., Heuett, W.J., Pressley, D.P. and Jones, C.M., 2022. Estimating weekly national opioid overdose deaths in near real time using multiple proxy data sources. JAMA network open, 5(7), p.e2223033.
- Myers, J.V., Marks, C., Kim, J., Fareed, N., Thomas, N., Whitley, P. and Fernandez, S., 2025. Generating Timely Estimates of Overdose Deaths for the US Using Urine Drug Test Data. JAMA Network Open, 8(6), pp.e2514402-e2514402.
- Lo-Ciganic, W.H., Huang, J.L., Zhang, H.H., Weiss, J.C., Wu, Y., Kwoh, C.K., Donohue, J.M., Cochran, G., Gordon, A.J., Malone, D.C. and Kuza, C.C., 2019. Evaluation of machine-learning algorithms for predicting opioid overdose risk among medicare beneficiaries with opioid prescriptions. JAMA network open, 2(3), pp.e190968-e190968.
- Lo-Ciganic, W.H., Huang, J.L., Zhang, H.H., Weiss, J.C., Kwoh, C.K., Donohue, J.M., Gordon, A.J., Cochran, G., Malone, D.C., Kuza, C.C. and Gellad, W.F., 2020. Using machine learning to predict risk of incident opioid use disorder among fee-for-service Medicare beneficiaries: a prognostic study. PloS one, 15(7), p.e0235981.
- Zhang, R., Song, H., Chen, Q., Wang, Y., Wang, S. and Li, Y., 2022. Comparison of ARIMA and LSTM for prediction of hemorrhagic fever at different time scales in China. Plos one, 17(1), p.e0262009.
- Makridakis, S., Spiliotis, E. and Assimakopoulos, V., 2018. Statistical and Machine Learning forecasting methods: Concerns and ways forward. PloS one, 13(3), p.e0194889.
- Wu, R.M., Shafiabady, N., Zhang, H., Lu, H., Gide, E., Liu, J. and Charbonnier, C.F.B., 2024. Comparative study of ten machine learning algorithms for short-term forecasting in gas warning systems. Scientific Reports, 14(1), p.21969.
- McCoy Jr, T.H., Pellegrini, A.M. and Perlis, R.H., 2018. Assessment of time-series machine learning methods for forecasting hospital discharge volume. JAMA network open, 1(7), p.e184087.
- Wang, Y.B., Qing, S.Y., Liang, Z.Y., Ma, C., Bai, Y.C. and Xu, C.J., 2023. Time series analysis-based seasonal autoregressive fractionally integrated moving average to estimate hepatitis B and C epidemics in China. World Journal of Gastroenterology, 29(42), p.5716.
- Al Mobin, M. and Kamrujjaman, M., 2023. Downscaling epidemiological time series data for improving forecasting accuracy: An algorithmic approach. Plos one, 18(12), p.e0295803.
- Cartus, A.R., Li, Y., Macmadu, A., Goedel, W.C., Allen, B., Cerdá, M. and Marshall, B.D., 2022. Forecasted and observed drug overdose deaths in the US during the COVID-19 pandemic in 2020. JAMA network open, 5(3), pp.e223418-e223418.
Declarations
Ethics approval and consent to participate
The manuscript reports that the institutional ethical review board considered the research exempt from IRB requirements because the study used existing public aggregate data.
Consent for publication
Not applicable.
Availability of data and materials
This article uses publicly available overdose mortality data described in the manuscript. Additional materials are available from the corresponding author on reasonable request.
Competing interests
The authors declare no commercial or financial conflict of interest.
Funding
No funding was received for this research.
Authors' contributions
Parash Bhakta: contribution details not captured | Neha Balapal: contribution details not captured | Saadh Ahmed: contribution details not captured | Michael Carlson: contribution details not captured | Paul Chong: contribution details not captured | Sammer Marzouk: contribution details not captured | Amala Ankem: contribution details not captured | Alister Martin: contribution details not captured | Norawit Kijpaisalratana: contribution details not captured | Abdul Badih El Ariss: contribution details not captured